Ecuadorian vs Immigrants from Burma/Myanmar Female Disability
COMPARE
Ecuadorian
Immigrants from Burma/Myanmar
Female Disability
Female Disability Comparison
Ecuadorians
Immigrants from Burma/Myanmar
11.9%
FEMALE DISABILITY
93.4/ 100
METRIC RATING
138th/ 347
METRIC RANK
12.4%
FEMALE DISABILITY
13.3/ 100
METRIC RATING
216th/ 347
METRIC RANK
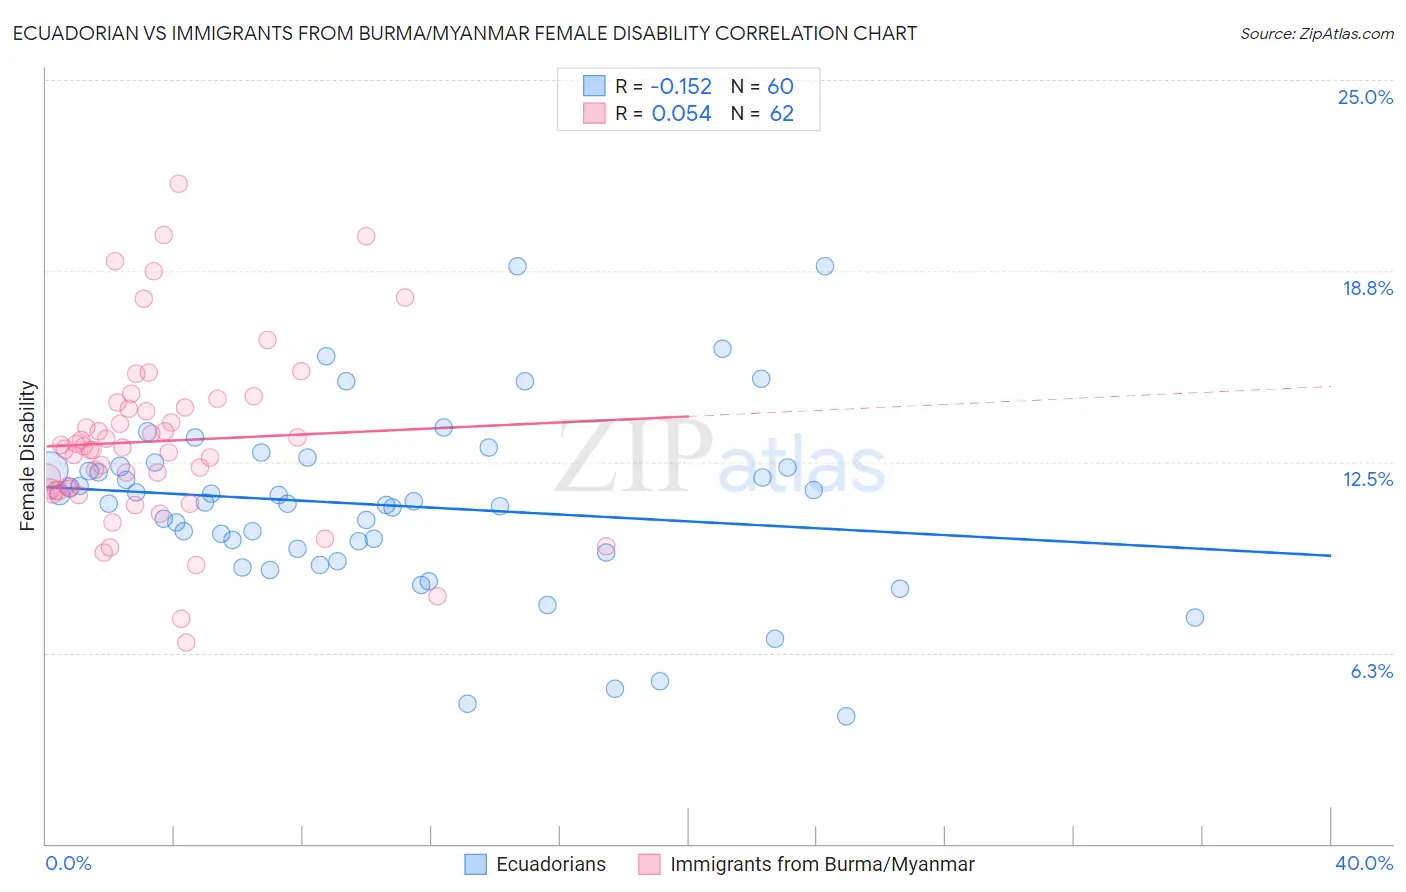
Ecuadorian vs Immigrants from Burma/Myanmar Female Disability Correlation Chart
The statistical analysis conducted on geographies consisting of 317,804,285 people shows a poor negative correlation between the proportion of Ecuadorians and percentage of females with a disability in the United States with a correlation coefficient (R) of -0.152 and weighted average of 11.9%. Similarly, the statistical analysis conducted on geographies consisting of 172,344,349 people shows a slight positive correlation between the proportion of Immigrants from Burma/Myanmar and percentage of females with a disability in the United States with a correlation coefficient (R) of 0.054 and weighted average of 12.4%, a difference of 4.4%.
Female Disability Correlation Summary
| Measurement | Ecuadorian | Immigrants from Burma/Myanmar |
| Minimum | 4.2% | 6.6% |
| Maximum | 18.9% | 21.6% |
| Range | 14.7% | 15.0% |
| Mean | 11.1% | 13.2% |
| Median | 11.2% | 12.9% |
| Interquartile 25% (IQ1) | 9.6% | 11.6% |
| Interquartile 75% (IQ3) | 12.3% | 14.3% |
| Interquartile Range (IQR) | 2.7% | 2.7% |
| Standard Deviation (Sample) | 2.9% | 2.9% |
| Standard Deviation (Population) | 2.9% | 2.9% |
Similar Demographics by Female Disability
Demographics Similar to Ecuadorians by Female Disability
In terms of female disability, the demographic groups most similar to Ecuadorians are Immigrants from Norway (11.9%, a difference of 0.060%), Immigrants from Hungary (11.9%, a difference of 0.090%), Ugandan (11.9%, a difference of 0.10%), Central American (11.9%, a difference of 0.12%), and Kenyan (11.9%, a difference of 0.19%).
| Demographics | Rating | Rank | Female Disability |
| Arabs | 95.1 /100 | #131 | Exceptional 11.9% |
| Immigrants | Syria | 94.6 /100 | #132 | Exceptional 11.9% |
| Kenyans | 94.5 /100 | #133 | Exceptional 11.9% |
| Immigrants | Nicaragua | 94.5 /100 | #134 | Exceptional 11.9% |
| Central Americans | 94.2 /100 | #135 | Exceptional 11.9% |
| Ugandans | 94.0 /100 | #136 | Exceptional 11.9% |
| Immigrants | Norway | 93.8 /100 | #137 | Exceptional 11.9% |
| Ecuadorians | 93.4 /100 | #138 | Exceptional 11.9% |
| Immigrants | Hungary | 92.8 /100 | #139 | Exceptional 11.9% |
| Romanians | 91.6 /100 | #140 | Exceptional 11.9% |
| Immigrants | Ecuador | 91.5 /100 | #141 | Exceptional 11.9% |
| Immigrants | Africa | 90.0 /100 | #142 | Excellent 11.9% |
| Immigrants | Sudan | 89.6 /100 | #143 | Excellent 11.9% |
| Immigrants | Austria | 87.9 /100 | #144 | Excellent 12.0% |
| Estonians | 87.8 /100 | #145 | Excellent 12.0% |
Demographics Similar to Immigrants from Burma/Myanmar by Female Disability
In terms of female disability, the demographic groups most similar to Immigrants from Burma/Myanmar are Panamanian (12.4%, a difference of 0.010%), Samoan (12.4%, a difference of 0.010%), British (12.4%, a difference of 0.050%), Immigrants from Bahamas (12.4%, a difference of 0.070%), and Immigrants from Thailand (12.4%, a difference of 0.090%).
| Demographics | Rating | Rank | Female Disability |
| Mexicans | 15.7 /100 | #209 | Poor 12.4% |
| Swiss | 14.9 /100 | #210 | Poor 12.4% |
| Immigrants | Bosnia and Herzegovina | 14.8 /100 | #211 | Poor 12.4% |
| Ute | 14.7 /100 | #212 | Poor 12.4% |
| Immigrants | Thailand | 14.5 /100 | #213 | Poor 12.4% |
| Panamanians | 13.5 /100 | #214 | Poor 12.4% |
| Samoans | 13.4 /100 | #215 | Poor 12.4% |
| Immigrants | Burma/Myanmar | 13.3 /100 | #216 | Poor 12.4% |
| British | 12.7 /100 | #217 | Poor 12.4% |
| Immigrants | Bahamas | 12.5 /100 | #218 | Poor 12.4% |
| Europeans | 12.1 /100 | #219 | Poor 12.4% |
| Bahamians | 11.1 /100 | #220 | Poor 12.4% |
| Native Hawaiians | 10.8 /100 | #221 | Poor 12.4% |
| Italians | 10.7 /100 | #222 | Poor 12.4% |
| Guamanians/Chamorros | 9.5 /100 | #223 | Tragic 12.5% |