Immigrants from Israel vs Immigrants from Albania Female Disability
COMPARE
Immigrants from Israel
Immigrants from Albania
Female Disability
Female Disability Comparison
Immigrants from Israel
Immigrants from Albania
10.7%
FEMALE DISABILITY
100.0/ 100
METRIC RATING
12th/ 347
METRIC RANK
12.3%
FEMALE DISABILITY
31.6/ 100
METRIC RATING
189th/ 347
METRIC RANK
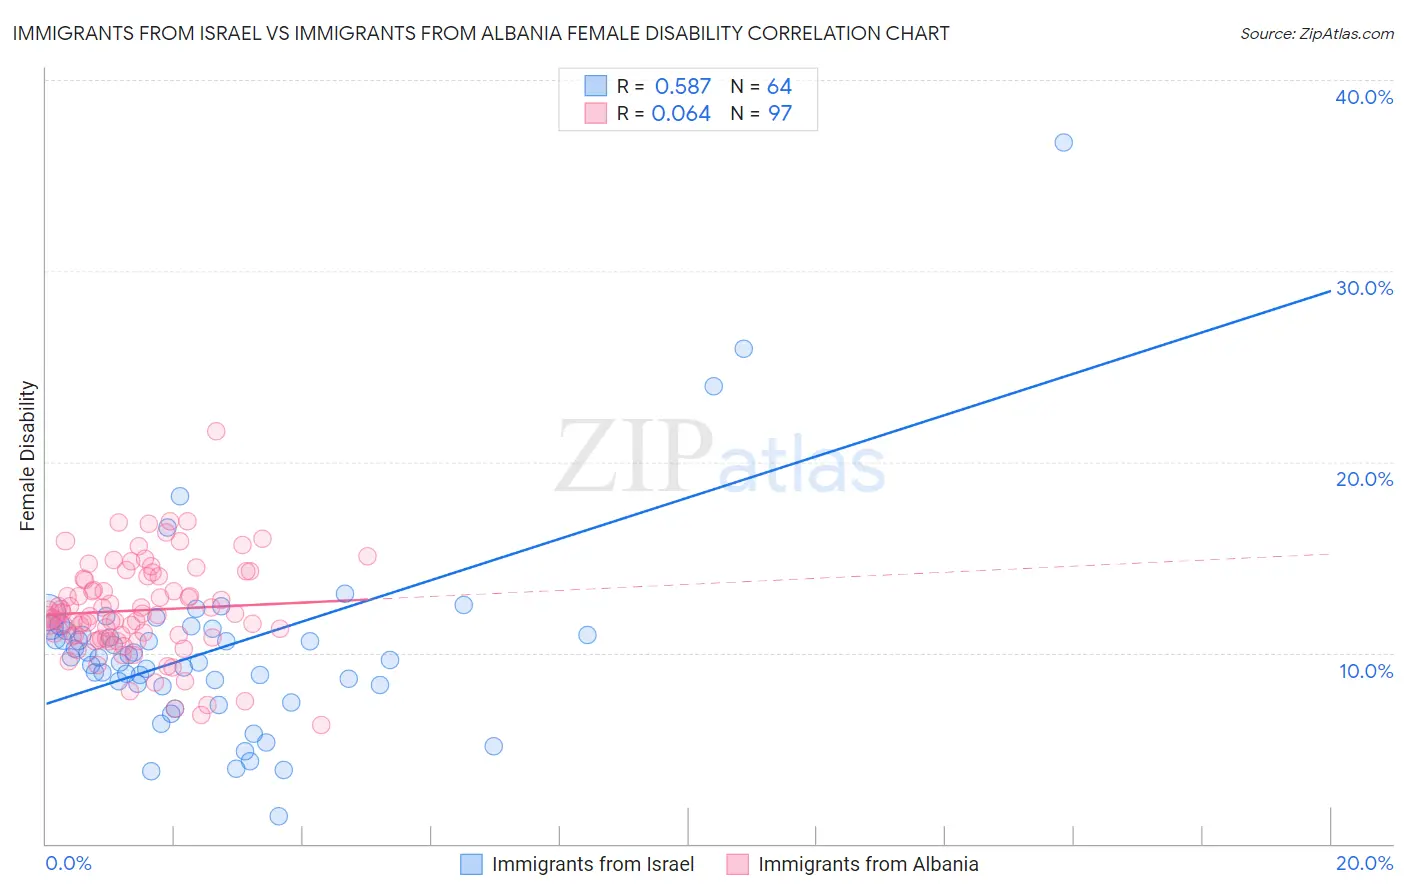
Immigrants from Israel vs Immigrants from Albania Female Disability Correlation Chart
The statistical analysis conducted on geographies consisting of 210,030,994 people shows a substantial positive correlation between the proportion of Immigrants from Israel and percentage of females with a disability in the United States with a correlation coefficient (R) of 0.587 and weighted average of 10.7%. Similarly, the statistical analysis conducted on geographies consisting of 119,399,114 people shows a slight positive correlation between the proportion of Immigrants from Albania and percentage of females with a disability in the United States with a correlation coefficient (R) of 0.064 and weighted average of 12.3%, a difference of 15.0%.
Female Disability Correlation Summary
| Measurement | Immigrants from Israel | Immigrants from Albania |
| Minimum | 1.5% | 6.2% |
| Maximum | 36.7% | 21.6% |
| Range | 35.2% | 15.4% |
| Mean | 10.2% | 12.2% |
| Median | 9.8% | 12.0% |
| Interquartile 25% (IQ1) | 8.4% | 10.8% |
| Interquartile 75% (IQ3) | 11.2% | 13.9% |
| Interquartile Range (IQR) | 2.8% | 3.1% |
| Standard Deviation (Sample) | 5.2% | 2.5% |
| Standard Deviation (Population) | 5.2% | 2.5% |
Similar Demographics by Female Disability
Demographics Similar to Immigrants from Israel by Female Disability
In terms of female disability, the demographic groups most similar to Immigrants from Israel are Immigrants from Eastern Asia (10.7%, a difference of 0.070%), Immigrants from China (10.7%, a difference of 0.11%), Immigrants from Korea (10.6%, a difference of 0.42%), Immigrants from Hong Kong (10.6%, a difference of 0.59%), and Burmese (10.7%, a difference of 0.62%).
| Demographics | Rating | Rank | Female Disability |
| Immigrants | Bolivia | 100.0 /100 | #5 | Exceptional 10.3% |
| Bolivians | 100.0 /100 | #6 | Exceptional 10.4% |
| Immigrants | Singapore | 100.0 /100 | #7 | Exceptional 10.4% |
| Immigrants | South Central Asia | 100.0 /100 | #8 | Exceptional 10.5% |
| Iranians | 100.0 /100 | #9 | Exceptional 10.6% |
| Immigrants | Hong Kong | 100.0 /100 | #10 | Exceptional 10.6% |
| Immigrants | Korea | 100.0 /100 | #11 | Exceptional 10.6% |
| Immigrants | Israel | 100.0 /100 | #12 | Exceptional 10.7% |
| Immigrants | Eastern Asia | 100.0 /100 | #13 | Exceptional 10.7% |
| Immigrants | China | 100.0 /100 | #14 | Exceptional 10.7% |
| Burmese | 100.0 /100 | #15 | Exceptional 10.7% |
| Okinawans | 100.0 /100 | #16 | Exceptional 10.8% |
| Indians (Asian) | 100.0 /100 | #17 | Exceptional 10.8% |
| Immigrants | Iran | 100.0 /100 | #18 | Exceptional 10.8% |
| Immigrants | Venezuela | 100.0 /100 | #19 | Exceptional 10.9% |
Demographics Similar to Immigrants from Albania by Female Disability
In terms of female disability, the demographic groups most similar to Immigrants from Albania are Immigrants from Honduras (12.3%, a difference of 0.010%), Immigrants from North America (12.3%, a difference of 0.050%), Serbian (12.3%, a difference of 0.070%), Austrian (12.3%, a difference of 0.080%), and Armenian (12.3%, a difference of 0.080%).
| Demographics | Rating | Rank | Female Disability |
| Norwegians | 36.9 /100 | #182 | Fair 12.3% |
| Cubans | 36.5 /100 | #183 | Fair 12.3% |
| Iraqis | 36.0 /100 | #184 | Fair 12.3% |
| Immigrants | Uzbekistan | 33.9 /100 | #185 | Fair 12.3% |
| Austrians | 33.3 /100 | #186 | Fair 12.3% |
| Serbians | 33.1 /100 | #187 | Fair 12.3% |
| Immigrants | North America | 32.8 /100 | #188 | Fair 12.3% |
| Immigrants | Albania | 31.6 /100 | #189 | Fair 12.3% |
| Immigrants | Honduras | 31.3 /100 | #190 | Fair 12.3% |
| Armenians | 29.7 /100 | #191 | Fair 12.3% |
| Immigrants | Western Africa | 29.2 /100 | #192 | Fair 12.3% |
| Northern Europeans | 27.5 /100 | #193 | Fair 12.3% |
| Ukrainians | 27.2 /100 | #194 | Fair 12.3% |
| Swedes | 26.6 /100 | #195 | Fair 12.3% |
| Immigrants | Panama | 25.5 /100 | #196 | Fair 12.3% |