Ecuadorian vs Immigrants from Nepal Female Disability
COMPARE
Ecuadorian
Immigrants from Nepal
Female Disability
Female Disability Comparison
Ecuadorians
Immigrants from Nepal
11.9%
FEMALE DISABILITY
93.4/ 100
METRIC RATING
138th/ 347
METRIC RANK
11.3%
FEMALE DISABILITY
100.0/ 100
METRIC RATING
46th/ 347
METRIC RANK
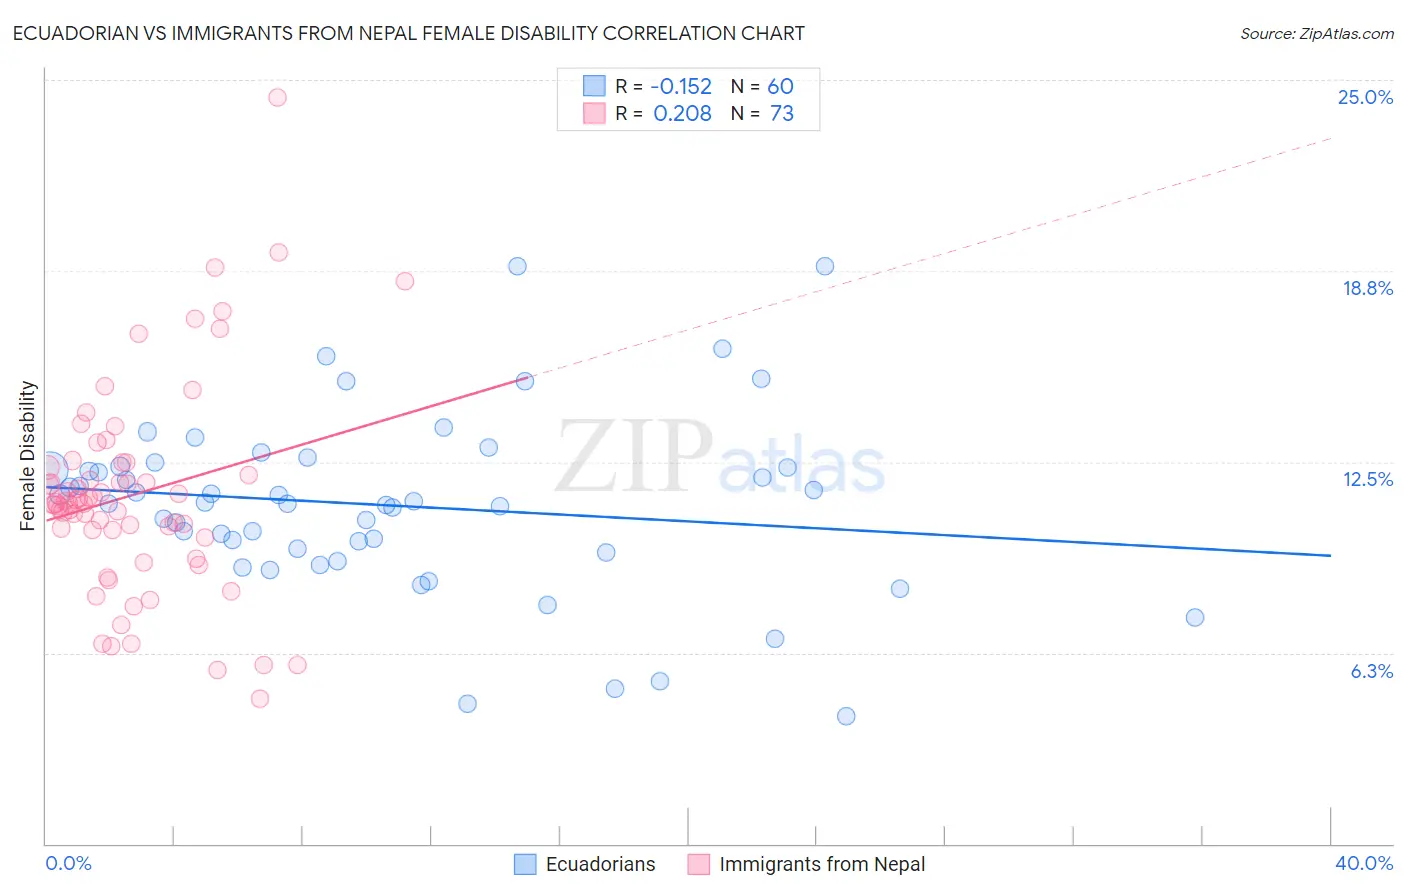
Ecuadorian vs Immigrants from Nepal Female Disability Correlation Chart
The statistical analysis conducted on geographies consisting of 317,804,285 people shows a poor negative correlation between the proportion of Ecuadorians and percentage of females with a disability in the United States with a correlation coefficient (R) of -0.152 and weighted average of 11.9%. Similarly, the statistical analysis conducted on geographies consisting of 186,780,675 people shows a weak positive correlation between the proportion of Immigrants from Nepal and percentage of females with a disability in the United States with a correlation coefficient (R) of 0.208 and weighted average of 11.3%, a difference of 5.5%.
Female Disability Correlation Summary
| Measurement | Ecuadorian | Immigrants from Nepal |
| Minimum | 4.2% | 4.7% |
| Maximum | 18.9% | 24.4% |
| Range | 14.7% | 19.7% |
| Mean | 11.1% | 11.4% |
| Median | 11.2% | 11.1% |
| Interquartile 25% (IQ1) | 9.6% | 10.1% |
| Interquartile 75% (IQ3) | 12.3% | 12.4% |
| Interquartile Range (IQR) | 2.7% | 2.2% |
| Standard Deviation (Sample) | 2.9% | 3.4% |
| Standard Deviation (Population) | 2.9% | 3.4% |
Similar Demographics by Female Disability
Demographics Similar to Ecuadorians by Female Disability
In terms of female disability, the demographic groups most similar to Ecuadorians are Immigrants from Norway (11.9%, a difference of 0.060%), Immigrants from Hungary (11.9%, a difference of 0.090%), Ugandan (11.9%, a difference of 0.10%), Central American (11.9%, a difference of 0.12%), and Kenyan (11.9%, a difference of 0.19%).
| Demographics | Rating | Rank | Female Disability |
| Arabs | 95.1 /100 | #131 | Exceptional 11.9% |
| Immigrants | Syria | 94.6 /100 | #132 | Exceptional 11.9% |
| Kenyans | 94.5 /100 | #133 | Exceptional 11.9% |
| Immigrants | Nicaragua | 94.5 /100 | #134 | Exceptional 11.9% |
| Central Americans | 94.2 /100 | #135 | Exceptional 11.9% |
| Ugandans | 94.0 /100 | #136 | Exceptional 11.9% |
| Immigrants | Norway | 93.8 /100 | #137 | Exceptional 11.9% |
| Ecuadorians | 93.4 /100 | #138 | Exceptional 11.9% |
| Immigrants | Hungary | 92.8 /100 | #139 | Exceptional 11.9% |
| Romanians | 91.6 /100 | #140 | Exceptional 11.9% |
| Immigrants | Ecuador | 91.5 /100 | #141 | Exceptional 11.9% |
| Immigrants | Africa | 90.0 /100 | #142 | Excellent 11.9% |
| Immigrants | Sudan | 89.6 /100 | #143 | Excellent 11.9% |
| Immigrants | Austria | 87.9 /100 | #144 | Excellent 12.0% |
| Estonians | 87.8 /100 | #145 | Excellent 12.0% |
Demographics Similar to Immigrants from Nepal by Female Disability
In terms of female disability, the demographic groups most similar to Immigrants from Nepal are Jordanian (11.3%, a difference of 0.020%), Zimbabwean (11.3%, a difference of 0.020%), Tongan (11.3%, a difference of 0.030%), Immigrants from Sweden (11.3%, a difference of 0.050%), and Cambodian (11.3%, a difference of 0.080%).
| Demographics | Rating | Rank | Female Disability |
| Immigrants | Lithuania | 100.0 /100 | #39 | Exceptional 11.2% |
| Mongolians | 100.0 /100 | #40 | Exceptional 11.2% |
| Paraguayans | 100.0 /100 | #41 | Exceptional 11.2% |
| Israelis | 100.0 /100 | #42 | Exceptional 11.2% |
| Afghans | 100.0 /100 | #43 | Exceptional 11.2% |
| Cambodians | 100.0 /100 | #44 | Exceptional 11.3% |
| Immigrants | Sweden | 100.0 /100 | #45 | Exceptional 11.3% |
| Immigrants | Nepal | 100.0 /100 | #46 | Exceptional 11.3% |
| Jordanians | 100.0 /100 | #47 | Exceptional 11.3% |
| Zimbabweans | 100.0 /100 | #48 | Exceptional 11.3% |
| Tongans | 100.0 /100 | #49 | Exceptional 11.3% |
| Inupiat | 100.0 /100 | #50 | Exceptional 11.3% |
| Immigrants | Belgium | 100.0 /100 | #51 | Exceptional 11.3% |
| Immigrants | Peru | 99.9 /100 | #52 | Exceptional 11.3% |
| Immigrants | Saudi Arabia | 99.9 /100 | #53 | Exceptional 11.3% |