Cuban vs Immigrants from Albania Female Disability
COMPARE
Cuban
Immigrants from Albania
Female Disability
Female Disability Comparison
Cubans
Immigrants from Albania
12.3%
FEMALE DISABILITY
36.5/ 100
METRIC RATING
183rd/ 347
METRIC RANK
12.3%
FEMALE DISABILITY
31.6/ 100
METRIC RATING
189th/ 347
METRIC RANK
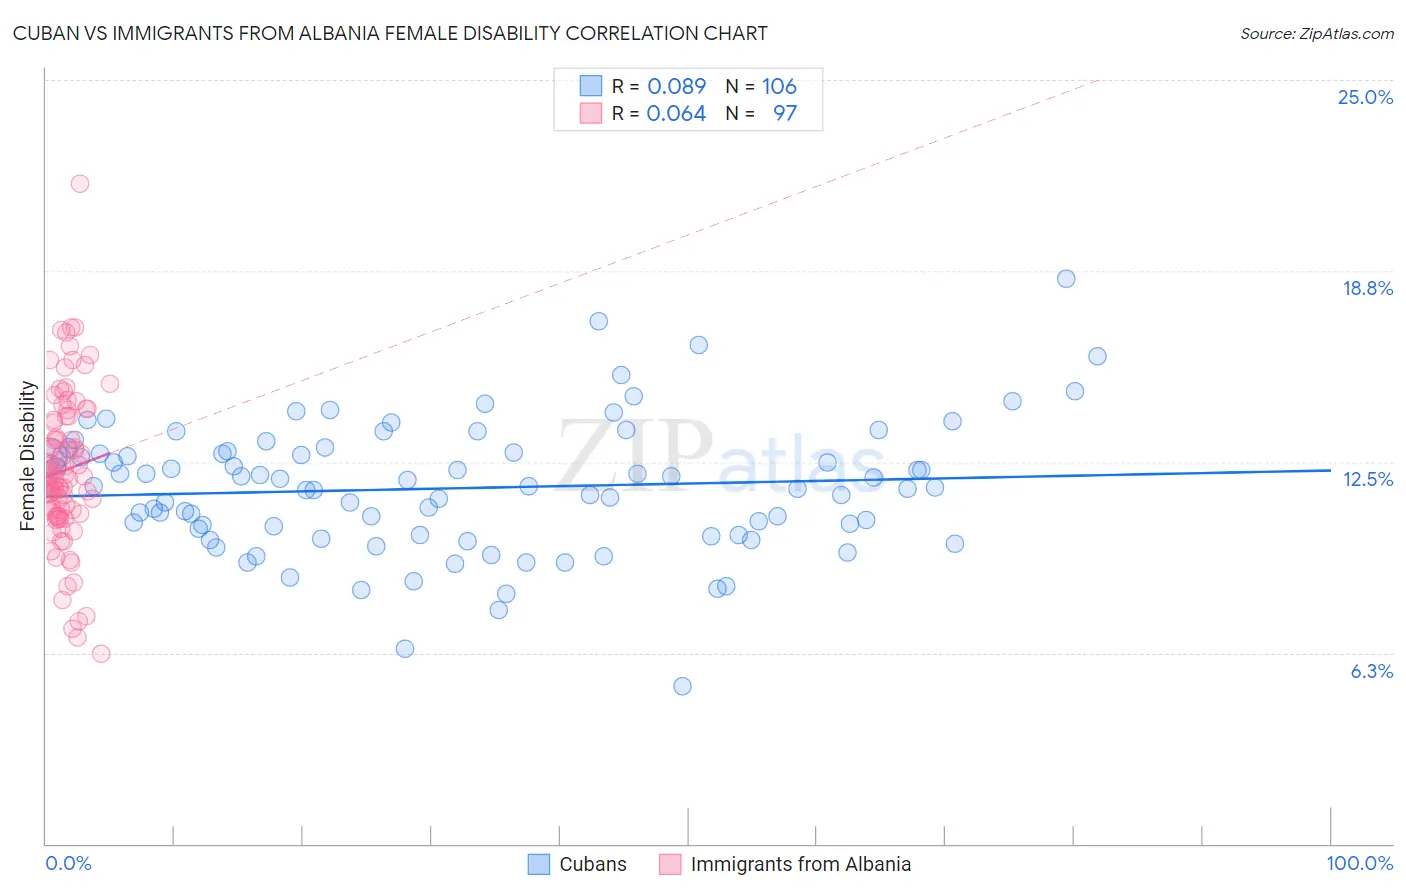
Cuban vs Immigrants from Albania Female Disability Correlation Chart
The statistical analysis conducted on geographies consisting of 449,245,212 people shows a slight positive correlation between the proportion of Cubans and percentage of females with a disability in the United States with a correlation coefficient (R) of 0.089 and weighted average of 12.3%. Similarly, the statistical analysis conducted on geographies consisting of 119,399,114 people shows a slight positive correlation between the proportion of Immigrants from Albania and percentage of females with a disability in the United States with a correlation coefficient (R) of 0.064 and weighted average of 12.3%, a difference of 0.21%.
Female Disability Correlation Summary
| Measurement | Cuban | Immigrants from Albania |
| Minimum | 5.2% | 6.2% |
| Maximum | 18.5% | 21.6% |
| Range | 13.3% | 15.4% |
| Mean | 11.6% | 12.2% |
| Median | 11.7% | 12.0% |
| Interquartile 25% (IQ1) | 10.1% | 10.8% |
| Interquartile 75% (IQ3) | 12.8% | 13.9% |
| Interquartile Range (IQR) | 2.7% | 3.1% |
| Standard Deviation (Sample) | 2.1% | 2.5% |
| Standard Deviation (Population) | 2.1% | 2.5% |
Demographics Similar to Cubans and Immigrants from Albania by Female Disability
In terms of female disability, the demographic groups most similar to Cubans are Norwegian (12.3%, a difference of 0.020%), Iraqi (12.3%, a difference of 0.020%), Immigrants from Canada (12.3%, a difference of 0.030%), Albanian (12.3%, a difference of 0.060%), and Immigrants from Fiji (12.3%, a difference of 0.070%). Similarly, the demographic groups most similar to Immigrants from Albania are Immigrants from Honduras (12.3%, a difference of 0.010%), Immigrants from North America (12.3%, a difference of 0.050%), Serbian (12.3%, a difference of 0.070%), Austrian (12.3%, a difference of 0.080%), and Armenian (12.3%, a difference of 0.080%).
| Demographics | Rating | Rank | Female Disability |
| Immigrants | Guyana | 43.1 /100 | #176 | Average 12.2% |
| Immigrants | Ghana | 42.5 /100 | #177 | Average 12.2% |
| Immigrants | Western Europe | 40.9 /100 | #178 | Average 12.2% |
| Immigrants | Fiji | 38.2 /100 | #179 | Fair 12.3% |
| Albanians | 37.9 /100 | #180 | Fair 12.3% |
| Immigrants | Canada | 37.2 /100 | #181 | Fair 12.3% |
| Norwegians | 36.9 /100 | #182 | Fair 12.3% |
| Cubans | 36.5 /100 | #183 | Fair 12.3% |
| Iraqis | 36.0 /100 | #184 | Fair 12.3% |
| Immigrants | Uzbekistan | 33.9 /100 | #185 | Fair 12.3% |
| Austrians | 33.3 /100 | #186 | Fair 12.3% |
| Serbians | 33.1 /100 | #187 | Fair 12.3% |
| Immigrants | North America | 32.8 /100 | #188 | Fair 12.3% |
| Immigrants | Albania | 31.6 /100 | #189 | Fair 12.3% |
| Immigrants | Honduras | 31.3 /100 | #190 | Fair 12.3% |
| Armenians | 29.7 /100 | #191 | Fair 12.3% |
| Immigrants | Western Africa | 29.2 /100 | #192 | Fair 12.3% |
| Northern Europeans | 27.5 /100 | #193 | Fair 12.3% |
| Ukrainians | 27.2 /100 | #194 | Fair 12.3% |
| Swedes | 26.6 /100 | #195 | Fair 12.3% |
| Immigrants | Panama | 25.5 /100 | #196 | Fair 12.3% |