Ecuadorian vs Immigrants from Albania Divorced or Separated
COMPARE
Ecuadorian
Immigrants from Albania
Divorced or Separated
Divorced or Separated Comparison
Ecuadorians
Immigrants from Albania
11.7%
DIVORCED OR SEPARATED
95.3/ 100
METRIC RATING
118th/ 347
METRIC RANK
11.5%
DIVORCED OR SEPARATED
99.3/ 100
METRIC RATING
85th/ 347
METRIC RANK
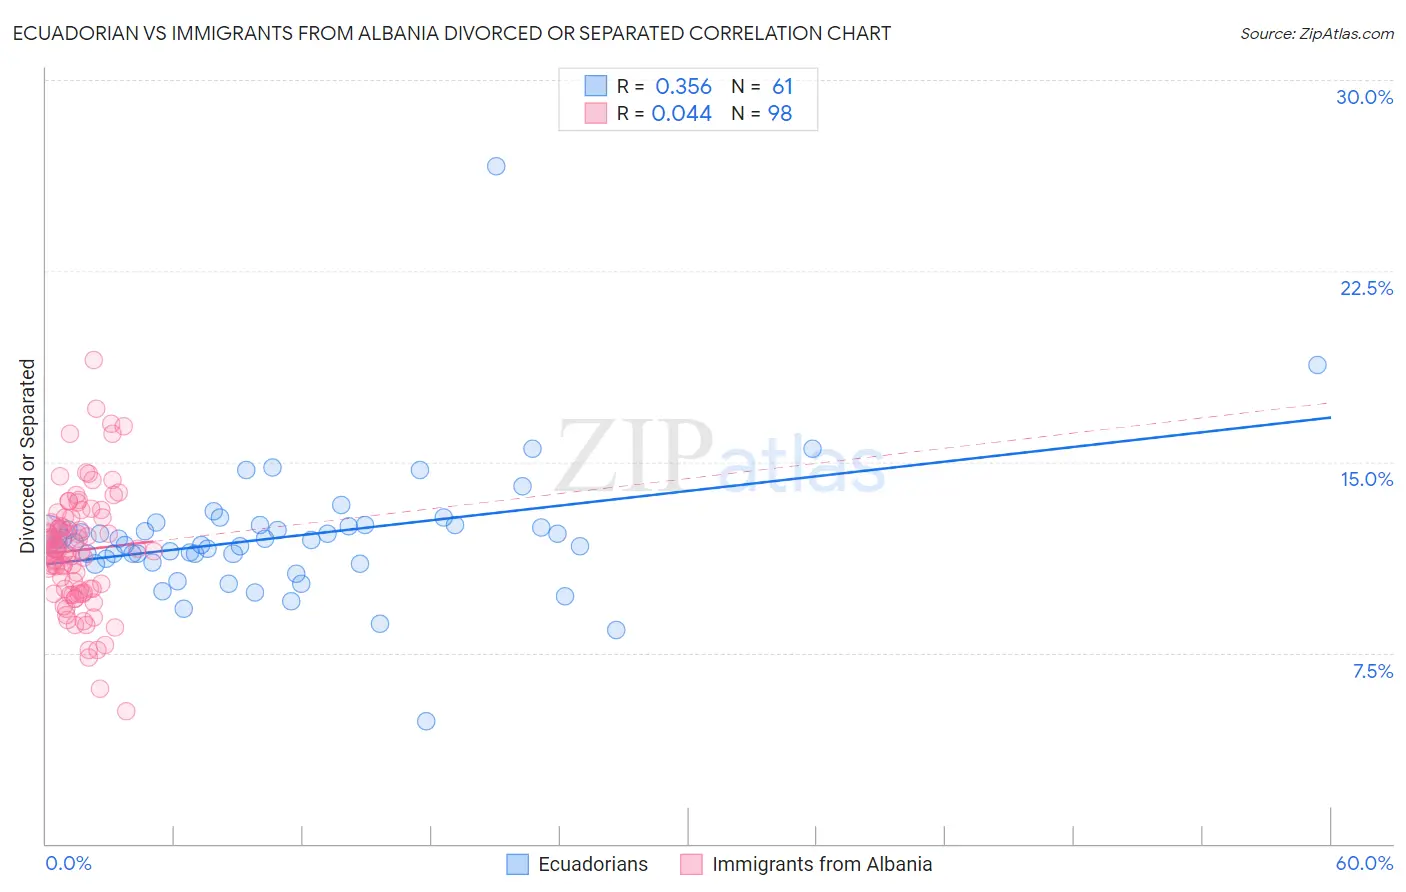
Ecuadorian vs Immigrants from Albania Divorced or Separated Correlation Chart
The statistical analysis conducted on geographies consisting of 317,712,201 people shows a mild positive correlation between the proportion of Ecuadorians and percentage of population currently divorced or separated in the United States with a correlation coefficient (R) of 0.356 and weighted average of 11.7%. Similarly, the statistical analysis conducted on geographies consisting of 119,378,737 people shows no correlation between the proportion of Immigrants from Albania and percentage of population currently divorced or separated in the United States with a correlation coefficient (R) of 0.044 and weighted average of 11.5%, a difference of 1.7%.
Divorced or Separated Correlation Summary
| Measurement | Ecuadorian | Immigrants from Albania |
| Minimum | 4.8% | 5.2% |
| Maximum | 26.6% | 19.0% |
| Range | 21.8% | 13.8% |
| Mean | 12.1% | 11.5% |
| Median | 11.8% | 11.5% |
| Interquartile 25% (IQ1) | 11.1% | 9.9% |
| Interquartile 75% (IQ3) | 12.5% | 12.8% |
| Interquartile Range (IQR) | 1.4% | 2.8% |
| Standard Deviation (Sample) | 2.7% | 2.3% |
| Standard Deviation (Population) | 2.7% | 2.3% |
Similar Demographics by Divorced or Separated
Demographics Similar to Ecuadorians by Divorced or Separated
In terms of divorced or separated, the demographic groups most similar to Ecuadorians are Immigrants from Uganda (11.7%, a difference of 0.0%), Immigrants from Iraq (11.7%, a difference of 0.020%), Syrian (11.7%, a difference of 0.040%), Lithuanian (11.7%, a difference of 0.090%), and Iraqi (11.8%, a difference of 0.13%).
| Demographics | Rating | Rank | Divorced or Separated |
| Immigrants | Spain | 96.8 /100 | #111 | Exceptional 11.7% |
| Immigrants | France | 96.6 /100 | #112 | Exceptional 11.7% |
| Estonians | 96.6 /100 | #113 | Exceptional 11.7% |
| Immigrants | Norway | 95.9 /100 | #114 | Exceptional 11.7% |
| Lithuanians | 95.7 /100 | #115 | Exceptional 11.7% |
| Immigrants | Iraq | 95.4 /100 | #116 | Exceptional 11.7% |
| Immigrants | Uganda | 95.3 /100 | #117 | Exceptional 11.7% |
| Ecuadorians | 95.3 /100 | #118 | Exceptional 11.7% |
| Syrians | 95.1 /100 | #119 | Exceptional 11.7% |
| Iraqis | 94.6 /100 | #120 | Exceptional 11.8% |
| Romanians | 94.5 /100 | #121 | Exceptional 11.8% |
| Menominee | 93.8 /100 | #122 | Exceptional 11.8% |
| Immigrants | Immigrants | 93.7 /100 | #123 | Exceptional 11.8% |
| Ugandans | 93.1 /100 | #124 | Exceptional 11.8% |
| Ukrainians | 92.3 /100 | #125 | Exceptional 11.8% |
Demographics Similar to Immigrants from Albania by Divorced or Separated
In terms of divorced or separated, the demographic groups most similar to Immigrants from Albania are Bulgarian (11.5%, a difference of 0.060%), Immigrants from Latvia (11.6%, a difference of 0.070%), Immigrants from Bulgaria (11.5%, a difference of 0.080%), Immigrants from Nepal (11.6%, a difference of 0.10%), and Immigrants from Romania (11.5%, a difference of 0.11%).
| Demographics | Rating | Rank | Divorced or Separated |
| Afghans | 99.4 /100 | #78 | Exceptional 11.5% |
| Guyanese | 99.4 /100 | #79 | Exceptional 11.5% |
| Immigrants | Switzerland | 99.4 /100 | #80 | Exceptional 11.5% |
| Russians | 99.4 /100 | #81 | Exceptional 11.5% |
| Immigrants | Romania | 99.3 /100 | #82 | Exceptional 11.5% |
| Immigrants | Bulgaria | 99.3 /100 | #83 | Exceptional 11.5% |
| Bulgarians | 99.3 /100 | #84 | Exceptional 11.5% |
| Immigrants | Albania | 99.3 /100 | #85 | Exceptional 11.5% |
| Immigrants | Latvia | 99.2 /100 | #86 | Exceptional 11.6% |
| Immigrants | Nepal | 99.2 /100 | #87 | Exceptional 11.6% |
| Immigrants | Europe | 99.2 /100 | #88 | Exceptional 11.6% |
| Immigrants | Southern Europe | 99.1 /100 | #89 | Exceptional 11.6% |
| Zimbabweans | 99.0 /100 | #90 | Exceptional 11.6% |
| Spanish American Indians | 99.0 /100 | #91 | Exceptional 11.6% |
| Immigrants | Denmark | 98.9 /100 | #92 | Exceptional 11.6% |