Ecuadorian vs U.S. Virgin Islander Female Disability
COMPARE
Ecuadorian
U.S. Virgin Islander
Female Disability
Female Disability Comparison
Ecuadorians
U.S. Virgin Islanders
11.9%
FEMALE DISABILITY
93.4/ 100
METRIC RATING
138th/ 347
METRIC RANK
13.1%
FEMALE DISABILITY
0.1/ 100
METRIC RATING
281st/ 347
METRIC RANK
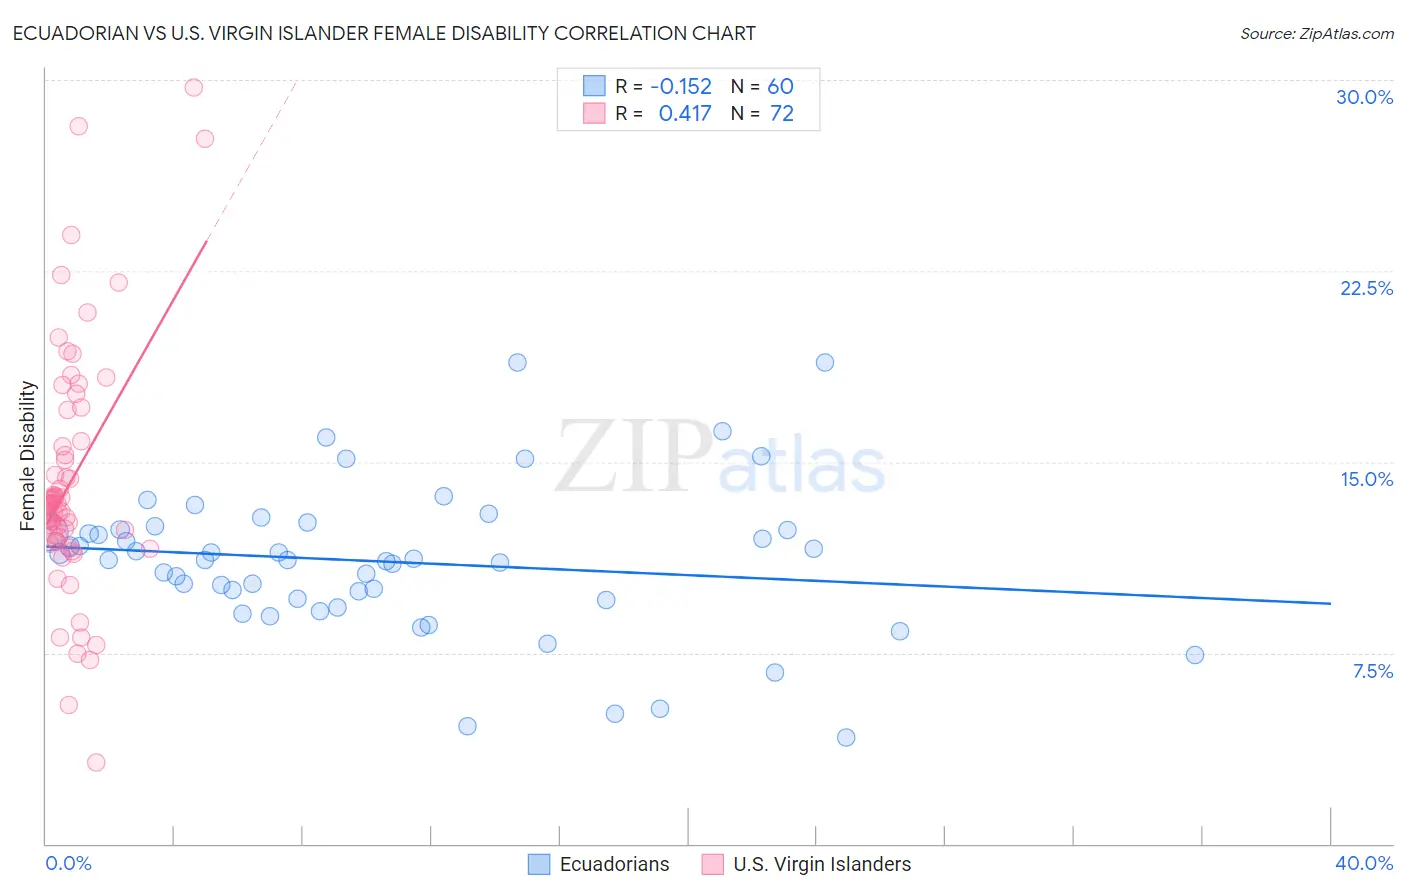
Ecuadorian vs U.S. Virgin Islander Female Disability Correlation Chart
The statistical analysis conducted on geographies consisting of 317,804,285 people shows a poor negative correlation between the proportion of Ecuadorians and percentage of females with a disability in the United States with a correlation coefficient (R) of -0.152 and weighted average of 11.9%. Similarly, the statistical analysis conducted on geographies consisting of 87,518,599 people shows a moderate positive correlation between the proportion of U.S. Virgin Islanders and percentage of females with a disability in the United States with a correlation coefficient (R) of 0.417 and weighted average of 13.1%, a difference of 9.8%.
Female Disability Correlation Summary
| Measurement | Ecuadorian | U.S. Virgin Islander |
| Minimum | 4.2% | 3.2% |
| Maximum | 18.9% | 29.7% |
| Range | 14.7% | 26.5% |
| Mean | 11.1% | 14.2% |
| Median | 11.2% | 13.3% |
| Interquartile 25% (IQ1) | 9.6% | 12.0% |
| Interquartile 75% (IQ3) | 12.3% | 15.7% |
| Interquartile Range (IQR) | 2.7% | 3.8% |
| Standard Deviation (Sample) | 2.9% | 4.8% |
| Standard Deviation (Population) | 2.9% | 4.8% |
Similar Demographics by Female Disability
Demographics Similar to Ecuadorians by Female Disability
In terms of female disability, the demographic groups most similar to Ecuadorians are Immigrants from Norway (11.9%, a difference of 0.060%), Immigrants from Hungary (11.9%, a difference of 0.090%), Ugandan (11.9%, a difference of 0.10%), Central American (11.9%, a difference of 0.12%), and Kenyan (11.9%, a difference of 0.19%).
| Demographics | Rating | Rank | Female Disability |
| Arabs | 95.1 /100 | #131 | Exceptional 11.9% |
| Immigrants | Syria | 94.6 /100 | #132 | Exceptional 11.9% |
| Kenyans | 94.5 /100 | #133 | Exceptional 11.9% |
| Immigrants | Nicaragua | 94.5 /100 | #134 | Exceptional 11.9% |
| Central Americans | 94.2 /100 | #135 | Exceptional 11.9% |
| Ugandans | 94.0 /100 | #136 | Exceptional 11.9% |
| Immigrants | Norway | 93.8 /100 | #137 | Exceptional 11.9% |
| Ecuadorians | 93.4 /100 | #138 | Exceptional 11.9% |
| Immigrants | Hungary | 92.8 /100 | #139 | Exceptional 11.9% |
| Romanians | 91.6 /100 | #140 | Exceptional 11.9% |
| Immigrants | Ecuador | 91.5 /100 | #141 | Exceptional 11.9% |
| Immigrants | Africa | 90.0 /100 | #142 | Excellent 11.9% |
| Immigrants | Sudan | 89.6 /100 | #143 | Excellent 11.9% |
| Immigrants | Austria | 87.9 /100 | #144 | Excellent 12.0% |
| Estonians | 87.8 /100 | #145 | Excellent 12.0% |
Demographics Similar to U.S. Virgin Islanders by Female Disability
In terms of female disability, the demographic groups most similar to U.S. Virgin Islanders are Irish (13.1%, a difference of 0.030%), Welsh (13.1%, a difference of 0.080%), English (13.1%, a difference of 0.080%), Arapaho (13.0%, a difference of 0.12%), and Hmong (13.1%, a difference of 0.22%).
| Demographics | Rating | Rank | Female Disability |
| Portuguese | 0.1 /100 | #274 | Tragic 13.0% |
| Cheyenne | 0.1 /100 | #275 | Tragic 13.0% |
| Immigrants | Dominica | 0.1 /100 | #276 | Tragic 13.0% |
| Spanish | 0.1 /100 | #277 | Tragic 13.0% |
| Scottish | 0.1 /100 | #278 | Tragic 13.0% |
| Arapaho | 0.1 /100 | #279 | Tragic 13.0% |
| Irish | 0.1 /100 | #280 | Tragic 13.1% |
| U.S. Virgin Islanders | 0.1 /100 | #281 | Tragic 13.1% |
| Welsh | 0.0 /100 | #282 | Tragic 13.1% |
| English | 0.0 /100 | #283 | Tragic 13.1% |
| Hmong | 0.0 /100 | #284 | Tragic 13.1% |
| Bangladeshis | 0.0 /100 | #285 | Tragic 13.1% |
| Fijians | 0.0 /100 | #286 | Tragic 13.1% |
| Yaqui | 0.0 /100 | #287 | Tragic 13.2% |
| Whites/Caucasians | 0.0 /100 | #288 | Tragic 13.2% |