Ecuadorian vs Tsimshian Female Disability
COMPARE
Ecuadorian
Tsimshian
Female Disability
Female Disability Comparison
Ecuadorians
Tsimshian
11.9%
FEMALE DISABILITY
93.4/ 100
METRIC RATING
138th/ 347
METRIC RANK
16.8%
FEMALE DISABILITY
0.0/ 100
METRIC RATING
346th/ 347
METRIC RANK
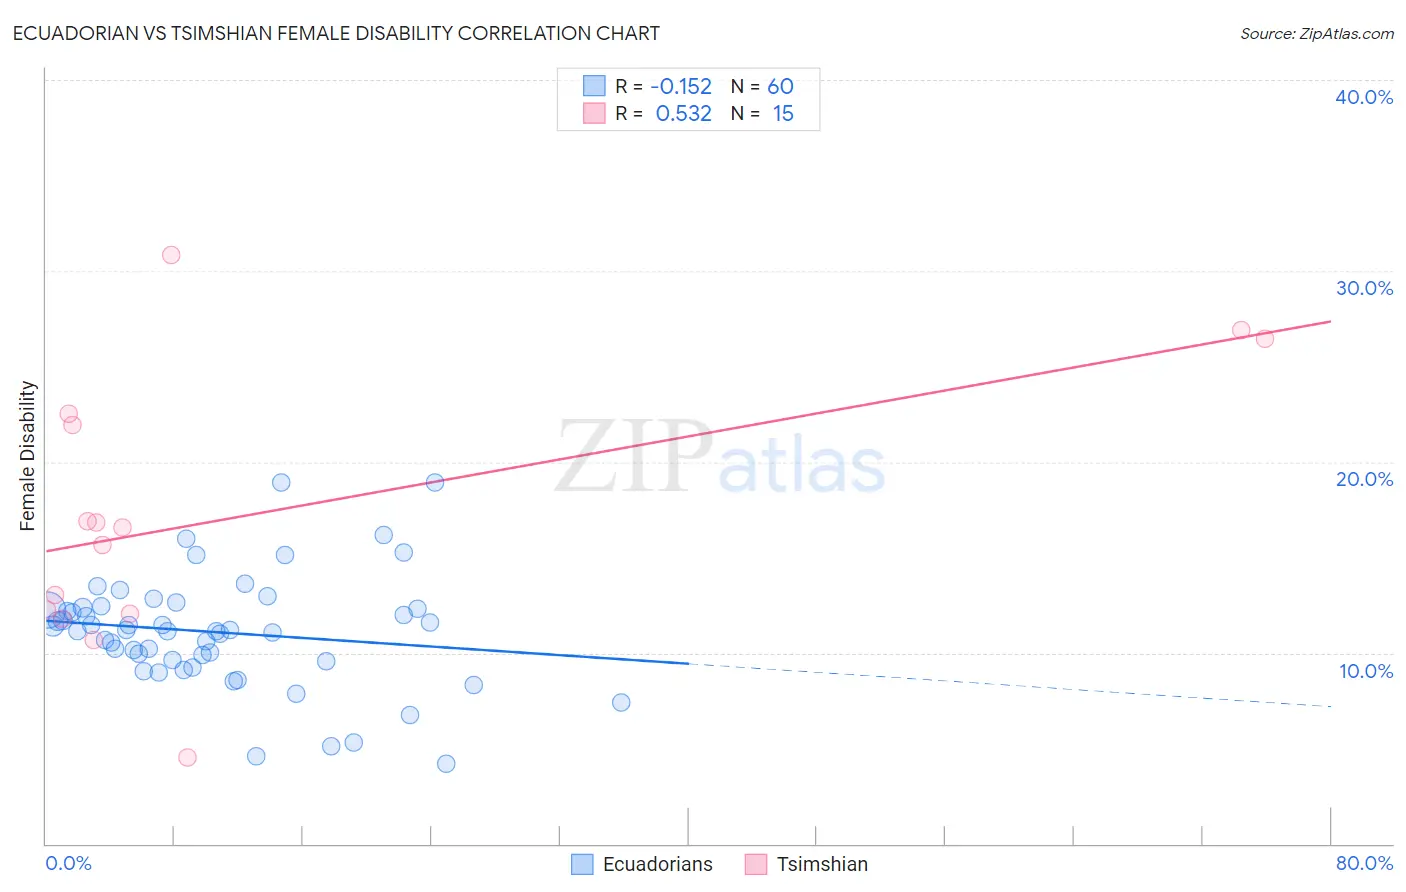
Ecuadorian vs Tsimshian Female Disability Correlation Chart
The statistical analysis conducted on geographies consisting of 317,804,285 people shows a poor negative correlation between the proportion of Ecuadorians and percentage of females with a disability in the United States with a correlation coefficient (R) of -0.152 and weighted average of 11.9%. Similarly, the statistical analysis conducted on geographies consisting of 15,626,462 people shows a substantial positive correlation between the proportion of Tsimshian and percentage of females with a disability in the United States with a correlation coefficient (R) of 0.532 and weighted average of 16.8%, a difference of 41.0%.
Female Disability Correlation Summary
| Measurement | Ecuadorian | Tsimshian |
| Minimum | 4.2% | 4.5% |
| Maximum | 18.9% | 30.9% |
| Range | 14.7% | 26.4% |
| Mean | 11.1% | 17.3% |
| Median | 11.2% | 16.6% |
| Interquartile 25% (IQ1) | 9.6% | 12.0% |
| Interquartile 75% (IQ3) | 12.3% | 22.5% |
| Interquartile Range (IQR) | 2.7% | 10.5% |
| Standard Deviation (Sample) | 2.9% | 7.2% |
| Standard Deviation (Population) | 2.9% | 6.9% |
Similar Demographics by Female Disability
Demographics Similar to Ecuadorians by Female Disability
In terms of female disability, the demographic groups most similar to Ecuadorians are Immigrants from Norway (11.9%, a difference of 0.060%), Immigrants from Hungary (11.9%, a difference of 0.090%), Ugandan (11.9%, a difference of 0.10%), Central American (11.9%, a difference of 0.12%), and Kenyan (11.9%, a difference of 0.19%).
| Demographics | Rating | Rank | Female Disability |
| Arabs | 95.1 /100 | #131 | Exceptional 11.9% |
| Immigrants | Syria | 94.6 /100 | #132 | Exceptional 11.9% |
| Kenyans | 94.5 /100 | #133 | Exceptional 11.9% |
| Immigrants | Nicaragua | 94.5 /100 | #134 | Exceptional 11.9% |
| Central Americans | 94.2 /100 | #135 | Exceptional 11.9% |
| Ugandans | 94.0 /100 | #136 | Exceptional 11.9% |
| Immigrants | Norway | 93.8 /100 | #137 | Exceptional 11.9% |
| Ecuadorians | 93.4 /100 | #138 | Exceptional 11.9% |
| Immigrants | Hungary | 92.8 /100 | #139 | Exceptional 11.9% |
| Romanians | 91.6 /100 | #140 | Exceptional 11.9% |
| Immigrants | Ecuador | 91.5 /100 | #141 | Exceptional 11.9% |
| Immigrants | Africa | 90.0 /100 | #142 | Excellent 11.9% |
| Immigrants | Sudan | 89.6 /100 | #143 | Excellent 11.9% |
| Immigrants | Austria | 87.9 /100 | #144 | Excellent 12.0% |
| Estonians | 87.8 /100 | #145 | Excellent 12.0% |
Demographics Similar to Tsimshian by Female Disability
In terms of female disability, the demographic groups most similar to Tsimshian are Houma (16.9%, a difference of 0.77%), Puerto Rican (16.6%, a difference of 0.94%), Kiowa (15.8%, a difference of 6.2%), Lumbee (15.8%, a difference of 6.3%), and Creek (15.7%, a difference of 7.1%).
| Demographics | Rating | Rank | Female Disability |
| Immigrants | Azores | 0.0 /100 | #333 | Tragic 14.9% |
| Cherokee | 0.0 /100 | #334 | Tragic 14.9% |
| Cajuns | 0.0 /100 | #335 | Tragic 14.9% |
| Seminole | 0.0 /100 | #336 | Tragic 15.0% |
| Tohono O'odham | 0.0 /100 | #337 | Tragic 15.0% |
| Dutch West Indians | 0.0 /100 | #338 | Tragic 15.0% |
| Colville | 0.0 /100 | #339 | Tragic 15.1% |
| Chickasaw | 0.0 /100 | #340 | Tragic 15.2% |
| Choctaw | 0.0 /100 | #341 | Tragic 15.4% |
| Creek | 0.0 /100 | #342 | Tragic 15.7% |
| Lumbee | 0.0 /100 | #343 | Tragic 15.8% |
| Kiowa | 0.0 /100 | #344 | Tragic 15.8% |
| Puerto Ricans | 0.0 /100 | #345 | Tragic 16.6% |
| Tsimshian | 0.0 /100 | #346 | Tragic 16.8% |
| Houma | 0.0 /100 | #347 | Tragic 16.9% |