Dutch West Indian vs Subsaharan African 3rd Grade
COMPARE
Dutch West Indian
Subsaharan African
3rd Grade
3rd Grade Comparison
Dutch West Indians
Sub-Saharan Africans
97.8%
3RD GRADE
55.5/ 100
METRIC RATING
166th/ 347
METRIC RANK
97.5%
3RD GRADE
3.2/ 100
METRIC RATING
228th/ 347
METRIC RANK
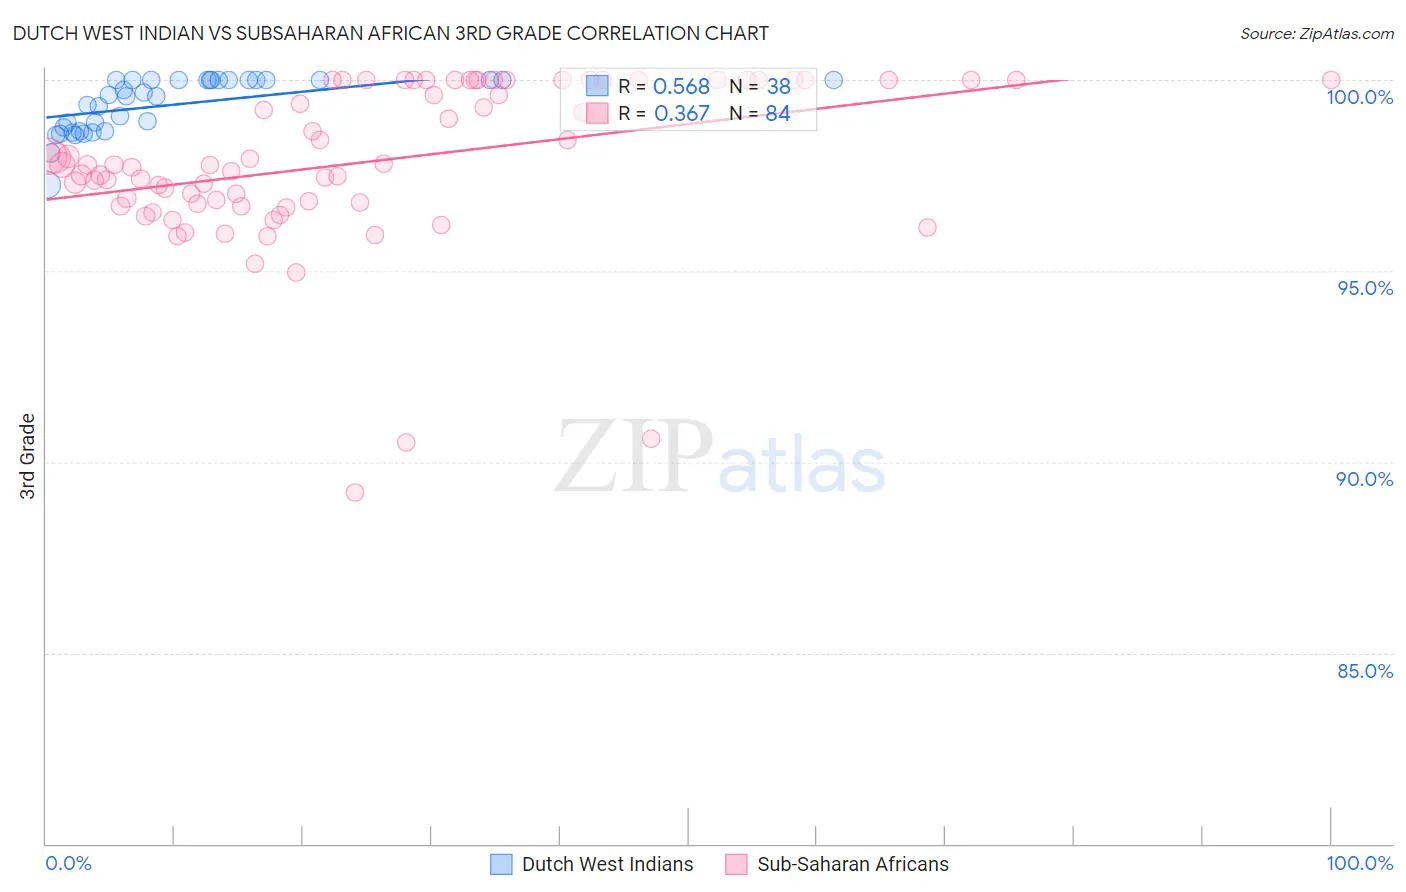
Dutch West Indian vs Subsaharan African 3rd Grade Correlation Chart
The statistical analysis conducted on geographies consisting of 85,776,075 people shows a substantial positive correlation between the proportion of Dutch West Indians and percentage of population with at least 3rd grade education in the United States with a correlation coefficient (R) of 0.568 and weighted average of 97.8%. Similarly, the statistical analysis conducted on geographies consisting of 508,209,936 people shows a mild positive correlation between the proportion of Sub-Saharan Africans and percentage of population with at least 3rd grade education in the United States with a correlation coefficient (R) of 0.367 and weighted average of 97.5%, a difference of 0.31%.
3rd Grade Correlation Summary
| Measurement | Dutch West Indian | Subsaharan African |
| Minimum | 97.2% | 89.2% |
| Maximum | 100.0% | 100.0% |
| Range | 2.8% | 10.8% |
| Mean | 99.4% | 97.9% |
| Median | 99.6% | 97.8% |
| Interquartile 25% (IQ1) | 98.7% | 96.8% |
| Interquartile 75% (IQ3) | 100.0% | 100.0% |
| Interquartile Range (IQR) | 1.3% | 3.2% |
| Standard Deviation (Sample) | 0.71% | 2.1% |
| Standard Deviation (Population) | 0.70% | 2.1% |
Similar Demographics by 3rd Grade
Demographics Similar to Dutch West Indians by 3rd Grade
In terms of 3rd grade, the demographic groups most similar to Dutch West Indians are Immigrants from Bosnia and Herzegovina (97.8%, a difference of 0.0%), Ugandan (97.8%, a difference of 0.0%), Chilean (97.8%, a difference of 0.0%), Immigrants from Spain (97.8%, a difference of 0.0%), and Immigrants from Iran (97.8%, a difference of 0.010%).
| Demographics | Rating | Rank | 3rd Grade |
| French American Indians | 60.0 /100 | #159 | Average 97.8% |
| Immigrants | Iran | 59.1 /100 | #160 | Average 97.8% |
| Albanians | 58.8 /100 | #161 | Average 97.8% |
| Immigrants | Jordan | 57.9 /100 | #162 | Average 97.8% |
| Marshallese | 57.2 /100 | #163 | Average 97.8% |
| Immigrants | Bosnia and Herzegovina | 56.2 /100 | #164 | Average 97.8% |
| Ugandans | 56.1 /100 | #165 | Average 97.8% |
| Dutch West Indians | 55.5 /100 | #166 | Average 97.8% |
| Chileans | 55.3 /100 | #167 | Average 97.8% |
| Immigrants | Spain | 54.3 /100 | #168 | Average 97.8% |
| Comanche | 53.8 /100 | #169 | Average 97.8% |
| Brazilians | 53.7 /100 | #170 | Average 97.8% |
| Kenyans | 51.8 /100 | #171 | Average 97.8% |
| Spanish Americans | 51.8 /100 | #172 | Average 97.8% |
| Immigrants | Korea | 50.9 /100 | #173 | Average 97.8% |
Demographics Similar to Sub-Saharan Africans by 3rd Grade
In terms of 3rd grade, the demographic groups most similar to Sub-Saharan Africans are Immigrants from Sudan (97.5%, a difference of 0.010%), Senegalese (97.5%, a difference of 0.010%), Immigrants from Pakistan (97.5%, a difference of 0.010%), Immigrants from Costa Rica (97.5%, a difference of 0.010%), and Sudanese (97.5%, a difference of 0.020%).
| Demographics | Rating | Rank | 3rd Grade |
| Uruguayans | 5.0 /100 | #221 | Tragic 97.5% |
| Sierra Leoneans | 4.6 /100 | #222 | Tragic 97.5% |
| Immigrants | Syria | 4.4 /100 | #223 | Tragic 97.5% |
| Bahamians | 4.4 /100 | #224 | Tragic 97.5% |
| Tongans | 4.3 /100 | #225 | Tragic 97.5% |
| Sudanese | 4.1 /100 | #226 | Tragic 97.5% |
| Immigrants | Sudan | 3.4 /100 | #227 | Tragic 97.5% |
| Sub-Saharan Africans | 3.2 /100 | #228 | Tragic 97.5% |
| Senegalese | 3.0 /100 | #229 | Tragic 97.5% |
| Immigrants | Pakistan | 2.7 /100 | #230 | Tragic 97.5% |
| Immigrants | Costa Rica | 2.7 /100 | #231 | Tragic 97.5% |
| Immigrants | Western Asia | 2.6 /100 | #232 | Tragic 97.5% |
| Immigrants | Malaysia | 2.4 /100 | #233 | Tragic 97.5% |
| Immigrants | Eastern Asia | 1.9 /100 | #234 | Tragic 97.4% |
| Immigrants | Iraq | 1.8 /100 | #235 | Tragic 97.4% |