Dutch West Indian vs Subsaharan African Unemployment Among Ages 45 to 54 years
COMPARE
Dutch West Indian
Subsaharan African
Unemployment Among Ages 45 to 54 years
Unemployment Among Ages 45 to 54 years Comparison
Dutch West Indians
Sub-Saharan Africans
5.0%
UNEMPLOYMENT AMONG AGES 45 TO 54 YEARS
0.0/ 100
METRIC RATING
278th/ 347
METRIC RANK
4.9%
UNEMPLOYMENT AMONG AGES 45 TO 54 YEARS
0.2/ 100
METRIC RATING
258th/ 347
METRIC RANK
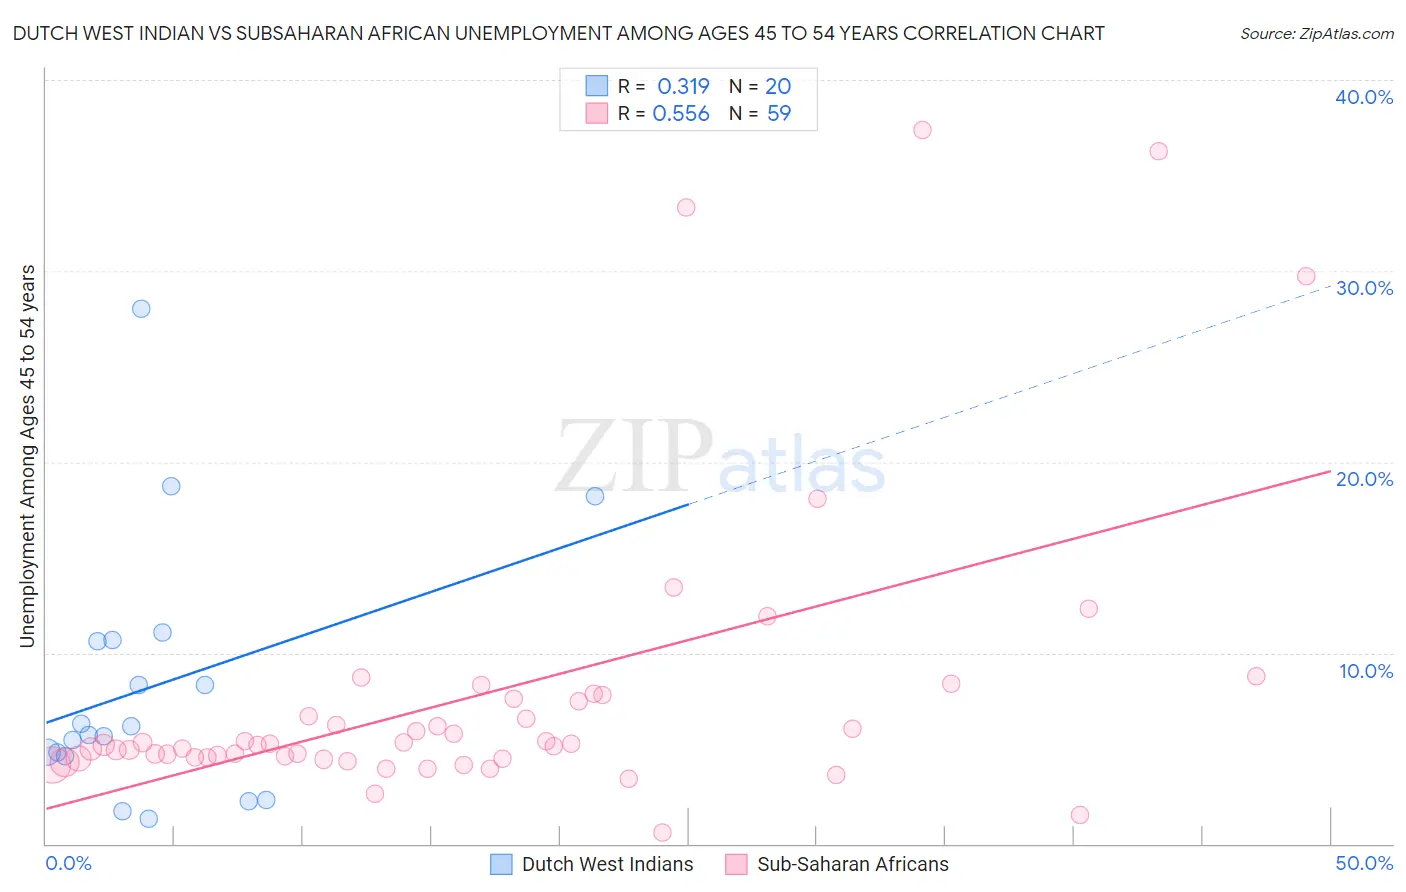
Dutch West Indian vs Subsaharan African Unemployment Among Ages 45 to 54 years Correlation Chart
The statistical analysis conducted on geographies consisting of 84,454,411 people shows a mild positive correlation between the proportion of Dutch West Indians and unemployment rate among population between the ages 45 and 54 in the United States with a correlation coefficient (R) of 0.319 and weighted average of 5.0%. Similarly, the statistical analysis conducted on geographies consisting of 486,803,720 people shows a substantial positive correlation between the proportion of Sub-Saharan Africans and unemployment rate among population between the ages 45 and 54 in the United States with a correlation coefficient (R) of 0.556 and weighted average of 4.9%, a difference of 3.7%.
Unemployment Among Ages 45 to 54 years Correlation Summary
| Measurement | Dutch West Indian | Subsaharan African |
| Minimum | 1.3% | 0.60% |
| Maximum | 28.0% | 37.4% |
| Range | 26.7% | 36.8% |
| Mean | 8.2% | 7.8% |
| Median | 5.9% | 5.2% |
| Interquartile 25% (IQ1) | 4.7% | 4.5% |
| Interquartile 75% (IQ3) | 10.7% | 7.6% |
| Interquartile Range (IQR) | 6.0% | 3.1% |
| Standard Deviation (Sample) | 6.7% | 7.7% |
| Standard Deviation (Population) | 6.5% | 7.7% |
Demographics Similar to Dutch West Indians and Sub-Saharan Africans by Unemployment Among Ages 45 to 54 years
In terms of unemployment among ages 45 to 54 years, the demographic groups most similar to Dutch West Indians are Immigrants from Mexico (5.0%, a difference of 0.21%), French American Indian (5.0%, a difference of 0.33%), Bermudan (5.0%, a difference of 0.94%), U.S. Virgin Islander (5.0%, a difference of 0.99%), and Immigrants from Latin America (5.0%, a difference of 1.1%). Similarly, the demographic groups most similar to Sub-Saharan Africans are Ugandan (4.9%, a difference of 0.15%), Mexican American Indian (4.9%, a difference of 0.16%), Guatemalan (4.9%, a difference of 0.17%), Mexican (4.9%, a difference of 0.40%), and Immigrants from Fiji (4.9%, a difference of 0.81%).
| Demographics | Rating | Rank | Unemployment Among Ages 45 to 54 years |
| Sub-Saharan Africans | 0.2 /100 | #258 | Tragic 4.9% |
| Ugandans | 0.1 /100 | #259 | Tragic 4.9% |
| Mexican American Indians | 0.1 /100 | #260 | Tragic 4.9% |
| Guatemalans | 0.1 /100 | #261 | Tragic 4.9% |
| Mexicans | 0.1 /100 | #262 | Tragic 4.9% |
| Immigrants | Fiji | 0.1 /100 | #263 | Tragic 4.9% |
| Immigrants | Guatemala | 0.1 /100 | #264 | Tragic 4.9% |
| Immigrants | Somalia | 0.1 /100 | #265 | Tragic 4.9% |
| Ghanaians | 0.0 /100 | #266 | Tragic 4.9% |
| Bahamians | 0.0 /100 | #267 | Tragic 4.9% |
| Immigrants | Uzbekistan | 0.0 /100 | #268 | Tragic 4.9% |
| Somalis | 0.0 /100 | #269 | Tragic 5.0% |
| Immigrants | Ghana | 0.0 /100 | #270 | Tragic 5.0% |
| Cajuns | 0.0 /100 | #271 | Tragic 5.0% |
| Immigrants | Central America | 0.0 /100 | #272 | Tragic 5.0% |
| Immigrants | Latin America | 0.0 /100 | #273 | Tragic 5.0% |
| U.S. Virgin Islanders | 0.0 /100 | #274 | Tragic 5.0% |
| Bermudans | 0.0 /100 | #275 | Tragic 5.0% |
| French American Indians | 0.0 /100 | #276 | Tragic 5.0% |
| Immigrants | Mexico | 0.0 /100 | #277 | Tragic 5.0% |
| Dutch West Indians | 0.0 /100 | #278 | Tragic 5.0% |