Dutch West Indian vs Arab Disability Age 5 to 17
COMPARE
Dutch West Indian
Arab
Disability Age 5 to 17
Disability Age 5 to 17 Comparison
Dutch West Indians
Arabs
6.7%
DISABILITY AGE 5 TO 17
0.0/ 100
METRIC RATING
330th/ 347
METRIC RANK
5.4%
DISABILITY AGE 5 TO 17
92.9/ 100
METRIC RATING
131st/ 347
METRIC RANK
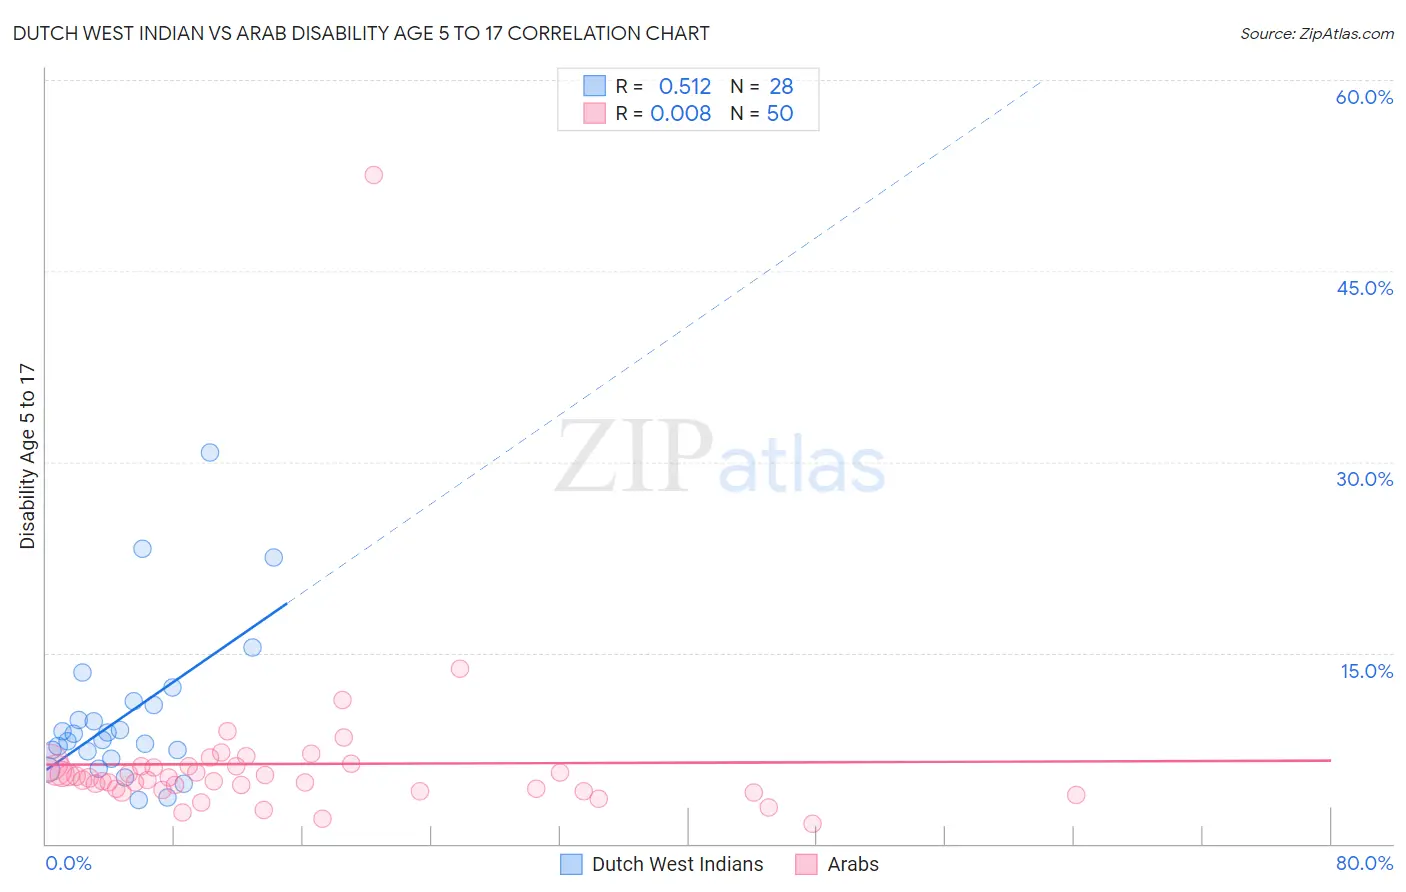
Dutch West Indian vs Arab Disability Age 5 to 17 Correlation Chart
The statistical analysis conducted on geographies consisting of 85,576,125 people shows a substantial positive correlation between the proportion of Dutch West Indians and percentage of population with a disability between the ages 5 and 17 in the United States with a correlation coefficient (R) of 0.512 and weighted average of 6.7%. Similarly, the statistical analysis conducted on geographies consisting of 481,041,182 people shows no correlation between the proportion of Arabs and percentage of population with a disability between the ages 5 and 17 in the United States with a correlation coefficient (R) of 0.008 and weighted average of 5.4%, a difference of 23.7%.
Disability Age 5 to 17 Correlation Summary
| Measurement | Dutch West Indian | Arab |
| Minimum | 3.5% | 1.6% |
| Maximum | 30.8% | 52.5% |
| Range | 27.3% | 50.9% |
| Mean | 10.1% | 6.3% |
| Median | 8.4% | 5.1% |
| Interquartile 25% (IQ1) | 7.0% | 4.2% |
| Interquartile 75% (IQ3) | 11.0% | 6.1% |
| Interquartile Range (IQR) | 4.1% | 1.9% |
| Standard Deviation (Sample) | 6.2% | 7.0% |
| Standard Deviation (Population) | 6.1% | 6.9% |
Similar Demographics by Disability Age 5 to 17
Demographics Similar to Dutch West Indians by Disability Age 5 to 17
In terms of disability age 5 to 17, the demographic groups most similar to Dutch West Indians are French Canadian (6.7%, a difference of 0.080%), Immigrants from the Azores (6.7%, a difference of 0.10%), Black/African American (6.8%, a difference of 0.69%), Seminole (6.8%, a difference of 0.74%), and Ottawa (6.8%, a difference of 1.5%).
| Demographics | Rating | Rank | Disability Age 5 to 17 |
| Osage | 0.0 /100 | #323 | Tragic 6.5% |
| Dominicans | 0.0 /100 | #324 | Tragic 6.5% |
| Americans | 0.0 /100 | #325 | Tragic 6.5% |
| Potawatomi | 0.0 /100 | #326 | Tragic 6.5% |
| French American Indians | 0.0 /100 | #327 | Tragic 6.6% |
| Pennsylvania Germans | 0.0 /100 | #328 | Tragic 6.6% |
| Blackfeet | 0.0 /100 | #329 | Tragic 6.6% |
| Dutch West Indians | 0.0 /100 | #330 | Tragic 6.7% |
| French Canadians | 0.0 /100 | #331 | Tragic 6.7% |
| Immigrants | Azores | 0.0 /100 | #332 | Tragic 6.7% |
| Blacks/African Americans | 0.0 /100 | #333 | Tragic 6.8% |
| Seminole | 0.0 /100 | #334 | Tragic 6.8% |
| Ottawa | 0.0 /100 | #335 | Tragic 6.8% |
| Chickasaw | 0.0 /100 | #336 | Tragic 6.8% |
| Creek | 0.0 /100 | #337 | Tragic 6.9% |
Demographics Similar to Arabs by Disability Age 5 to 17
In terms of disability age 5 to 17, the demographic groups most similar to Arabs are Immigrants from Colombia (5.4%, a difference of 0.020%), Venezuelan (5.4%, a difference of 0.050%), Yuman (5.4%, a difference of 0.13%), Immigrants from Belize (5.4%, a difference of 0.22%), and Immigrants from Bulgaria (5.4%, a difference of 0.23%).
| Demographics | Rating | Rank | Disability Age 5 to 17 |
| Crow | 95.0 /100 | #124 | Exceptional 5.4% |
| Immigrants | Chile | 95.0 /100 | #125 | Exceptional 5.4% |
| New Zealanders | 95.0 /100 | #126 | Exceptional 5.4% |
| Latvians | 95.0 /100 | #127 | Exceptional 5.4% |
| Immigrants | Venezuela | 94.5 /100 | #128 | Exceptional 5.4% |
| Romanians | 94.1 /100 | #129 | Exceptional 5.4% |
| Immigrants | Bulgaria | 94.0 /100 | #130 | Exceptional 5.4% |
| Arabs | 92.9 /100 | #131 | Exceptional 5.4% |
| Immigrants | Colombia | 92.9 /100 | #132 | Exceptional 5.4% |
| Venezuelans | 92.7 /100 | #133 | Exceptional 5.4% |
| Yuman | 92.3 /100 | #134 | Exceptional 5.4% |
| Immigrants | Belize | 91.7 /100 | #135 | Exceptional 5.4% |
| Immigrants | Denmark | 91.4 /100 | #136 | Exceptional 5.4% |
| Navajo | 90.9 /100 | #137 | Exceptional 5.4% |
| Immigrants | Oceania | 90.8 /100 | #138 | Exceptional 5.4% |