Dutch West Indian vs Immigrants from El Salvador Disability Age 5 to 17
COMPARE
Dutch West Indian
Immigrants from El Salvador
Disability Age 5 to 17
Disability Age 5 to 17 Comparison
Dutch West Indians
Immigrants from El Salvador
6.7%
DISABILITY AGE 5 TO 17
0.0/ 100
METRIC RATING
330th/ 347
METRIC RANK
5.3%
DISABILITY AGE 5 TO 17
99.0/ 100
METRIC RATING
96th/ 347
METRIC RANK
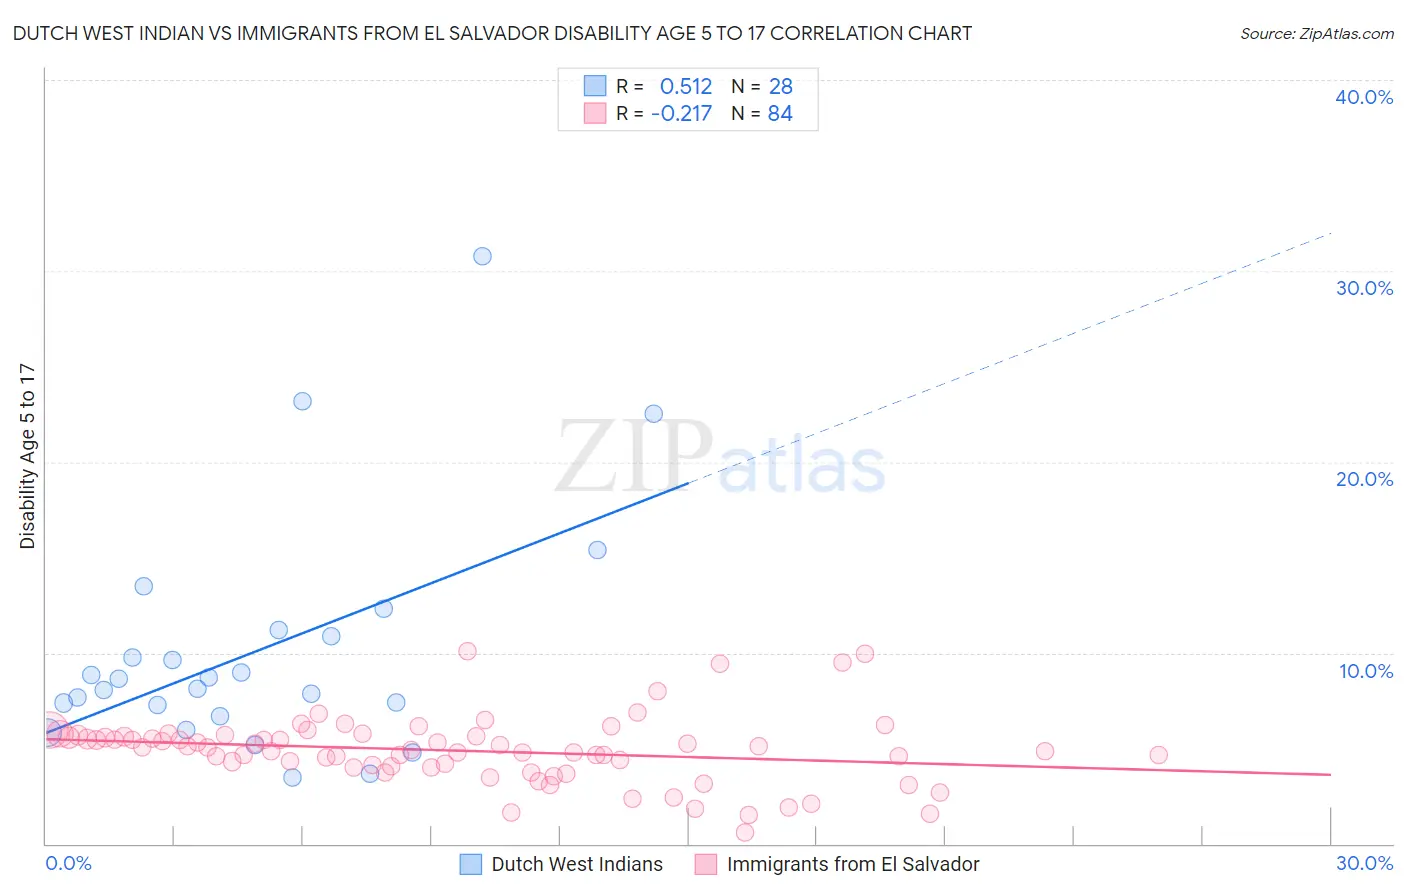
Dutch West Indian vs Immigrants from El Salvador Disability Age 5 to 17 Correlation Chart
The statistical analysis conducted on geographies consisting of 85,576,125 people shows a substantial positive correlation between the proportion of Dutch West Indians and percentage of population with a disability between the ages 5 and 17 in the United States with a correlation coefficient (R) of 0.512 and weighted average of 6.7%. Similarly, the statistical analysis conducted on geographies consisting of 355,746,060 people shows a weak negative correlation between the proportion of Immigrants from El Salvador and percentage of population with a disability between the ages 5 and 17 in the United States with a correlation coefficient (R) of -0.217 and weighted average of 5.3%, a difference of 27.0%.
Disability Age 5 to 17 Correlation Summary
| Measurement | Dutch West Indian | Immigrants from El Salvador |
| Minimum | 3.5% | 0.57% |
| Maximum | 30.8% | 10.1% |
| Range | 27.3% | 9.5% |
| Mean | 10.1% | 4.9% |
| Median | 8.4% | 5.0% |
| Interquartile 25% (IQ1) | 7.0% | 4.0% |
| Interquartile 75% (IQ3) | 11.0% | 5.6% |
| Interquartile Range (IQR) | 4.1% | 1.6% |
| Standard Deviation (Sample) | 6.2% | 1.8% |
| Standard Deviation (Population) | 6.1% | 1.7% |
Similar Demographics by Disability Age 5 to 17
Demographics Similar to Dutch West Indians by Disability Age 5 to 17
In terms of disability age 5 to 17, the demographic groups most similar to Dutch West Indians are French Canadian (6.7%, a difference of 0.080%), Immigrants from the Azores (6.7%, a difference of 0.10%), Black/African American (6.8%, a difference of 0.69%), Seminole (6.8%, a difference of 0.74%), and Ottawa (6.8%, a difference of 1.5%).
| Demographics | Rating | Rank | Disability Age 5 to 17 |
| Osage | 0.0 /100 | #323 | Tragic 6.5% |
| Dominicans | 0.0 /100 | #324 | Tragic 6.5% |
| Americans | 0.0 /100 | #325 | Tragic 6.5% |
| Potawatomi | 0.0 /100 | #326 | Tragic 6.5% |
| French American Indians | 0.0 /100 | #327 | Tragic 6.6% |
| Pennsylvania Germans | 0.0 /100 | #328 | Tragic 6.6% |
| Blackfeet | 0.0 /100 | #329 | Tragic 6.6% |
| Dutch West Indians | 0.0 /100 | #330 | Tragic 6.7% |
| French Canadians | 0.0 /100 | #331 | Tragic 6.7% |
| Immigrants | Azores | 0.0 /100 | #332 | Tragic 6.7% |
| Blacks/African Americans | 0.0 /100 | #333 | Tragic 6.8% |
| Seminole | 0.0 /100 | #334 | Tragic 6.8% |
| Ottawa | 0.0 /100 | #335 | Tragic 6.8% |
| Chickasaw | 0.0 /100 | #336 | Tragic 6.8% |
| Creek | 0.0 /100 | #337 | Tragic 6.9% |
Demographics Similar to Immigrants from El Salvador by Disability Age 5 to 17
In terms of disability age 5 to 17, the demographic groups most similar to Immigrants from El Salvador are Immigrants from Europe (5.3%, a difference of 0.0%), Immigrants from Austria (5.3%, a difference of 0.050%), Cambodian (5.3%, a difference of 0.15%), Immigrants from Grenada (5.3%, a difference of 0.16%), and Immigrants from Jordan (5.3%, a difference of 0.18%).
| Demographics | Rating | Rank | Disability Age 5 to 17 |
| Immigrants | Spain | 99.4 /100 | #89 | Exceptional 5.2% |
| Immigrants | Kuwait | 99.4 /100 | #90 | Exceptional 5.3% |
| Mongolians | 99.2 /100 | #91 | Exceptional 5.3% |
| Luxembourgers | 99.2 /100 | #92 | Exceptional 5.3% |
| Immigrants | Peru | 99.1 /100 | #93 | Exceptional 5.3% |
| Immigrants | Jordan | 99.1 /100 | #94 | Exceptional 5.3% |
| Immigrants | Grenada | 99.1 /100 | #95 | Exceptional 5.3% |
| Immigrants | El Salvador | 99.0 /100 | #96 | Exceptional 5.3% |
| Immigrants | Europe | 99.0 /100 | #97 | Exceptional 5.3% |
| Immigrants | Austria | 98.9 /100 | #98 | Exceptional 5.3% |
| Cambodians | 98.8 /100 | #99 | Exceptional 5.3% |
| Nepalese | 98.7 /100 | #100 | Exceptional 5.3% |
| Menominee | 98.7 /100 | #101 | Exceptional 5.3% |
| Nicaraguans | 98.6 /100 | #102 | Exceptional 5.3% |
| Salvadorans | 98.6 /100 | #103 | Exceptional 5.3% |