Dutch West Indian vs Nonimmigrants In Labor Force | Age 16-19
COMPARE
Dutch West Indian
Nonimmigrants
In Labor Force | Age 16-19
In Labor Force | Age 16-19 Comparison
Dutch West Indians
Nonimmigrants
35.6%
IN LABOR FORCE | AGE 16-19
10.7/ 100
METRIC RATING
216th/ 347
METRIC RANK
40.1%
IN LABOR FORCE | AGE 16-19
100.0/ 100
METRIC RATING
66th/ 347
METRIC RANK
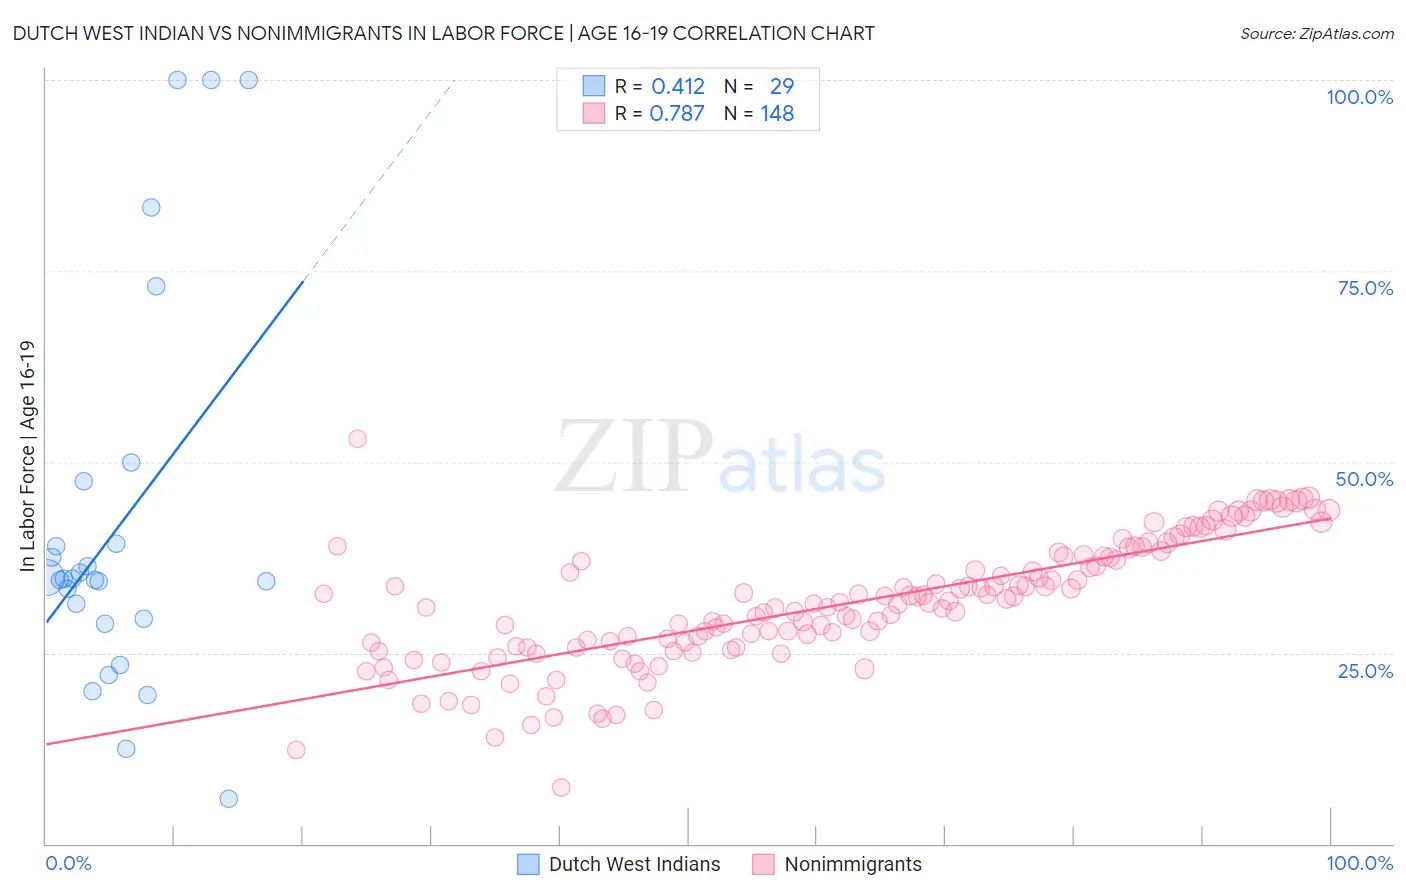
Dutch West Indian vs Nonimmigrants In Labor Force | Age 16-19 Correlation Chart
The statistical analysis conducted on geographies consisting of 85,687,209 people shows a moderate positive correlation between the proportion of Dutch West Indians and labor force participation rate among population between the ages 16 and 19 in the United States with a correlation coefficient (R) of 0.412 and weighted average of 35.6%. Similarly, the statistical analysis conducted on geographies consisting of 578,466,762 people shows a strong positive correlation between the proportion of Nonimmigrants and labor force participation rate among population between the ages 16 and 19 in the United States with a correlation coefficient (R) of 0.787 and weighted average of 40.1%, a difference of 12.6%.
In Labor Force | Age 16-19 Correlation Summary
| Measurement | Dutch West Indian | Nonimmigrants |
| Minimum | 5.9% | 7.3% |
| Maximum | 100.0% | 53.1% |
| Range | 94.1% | 45.8% |
| Mean | 41.7% | 31.6% |
| Median | 34.6% | 31.6% |
| Interquartile 25% (IQ1) | 29.1% | 25.8% |
| Interquartile 75% (IQ3) | 43.4% | 37.7% |
| Interquartile Range (IQR) | 14.3% | 12.0% |
| Standard Deviation (Sample) | 25.2% | 8.3% |
| Standard Deviation (Population) | 24.8% | 8.3% |
Similar Demographics by In Labor Force | Age 16-19
Demographics Similar to Dutch West Indians by In Labor Force | Age 16-19
In terms of in labor force | age 16-19, the demographic groups most similar to Dutch West Indians are Immigrants from Costa Rica (35.6%, a difference of 0.0%), Immigrants from South Eastern Asia (35.6%, a difference of 0.020%), Apache (35.6%, a difference of 0.040%), Houma (35.6%, a difference of 0.050%), and Immigrants from Bolivia (35.6%, a difference of 0.050%).
| Demographics | Rating | Rank | In Labor Force | Age 16-19 |
| Moroccans | 12.7 /100 | #209 | Poor 35.7% |
| Immigrants | Switzerland | 11.9 /100 | #210 | Poor 35.6% |
| Mexicans | 11.9 /100 | #211 | Poor 35.6% |
| Houma | 11.0 /100 | #212 | Poor 35.6% |
| Immigrants | Bolivia | 11.0 /100 | #213 | Poor 35.6% |
| Apache | 11.0 /100 | #214 | Poor 35.6% |
| Immigrants | South Eastern Asia | 10.8 /100 | #215 | Poor 35.6% |
| Dutch West Indians | 10.7 /100 | #216 | Poor 35.6% |
| Immigrants | Costa Rica | 10.7 /100 | #217 | Poor 35.6% |
| Sri Lankans | 9.8 /100 | #218 | Tragic 35.5% |
| Guatemalans | 8.6 /100 | #219 | Tragic 35.5% |
| Immigrants | Bahamas | 8.3 /100 | #220 | Tragic 35.5% |
| Turks | 7.3 /100 | #221 | Tragic 35.4% |
| Immigrants | Ghana | 7.3 /100 | #222 | Tragic 35.4% |
| Ghanaians | 6.5 /100 | #223 | Tragic 35.3% |
Demographics Similar to Nonimmigrants by In Labor Force | Age 16-19
In terms of in labor force | age 16-19, the demographic groups most similar to Nonimmigrants are Canadian (40.1%, a difference of 0.010%), Italian (40.1%, a difference of 0.070%), Kenyan (40.1%, a difference of 0.12%), Potawatomi (40.0%, a difference of 0.14%), and Portuguese (40.0%, a difference of 0.19%).
| Demographics | Rating | Rank | In Labor Force | Age 16-19 |
| Slavs | 100.0 /100 | #59 | Exceptional 40.4% |
| Immigrants | Eastern Africa | 100.0 /100 | #60 | Exceptional 40.4% |
| Americans | 100.0 /100 | #61 | Exceptional 40.3% |
| Cherokee | 100.0 /100 | #62 | Exceptional 40.2% |
| Northern Europeans | 100.0 /100 | #63 | Exceptional 40.2% |
| Immigrants | Micronesia | 100.0 /100 | #64 | Exceptional 40.2% |
| Kenyans | 100.0 /100 | #65 | Exceptional 40.1% |
| Immigrants | Nonimmigrants | 100.0 /100 | #66 | Exceptional 40.1% |
| Canadians | 100.0 /100 | #67 | Exceptional 40.1% |
| Italians | 99.9 /100 | #68 | Exceptional 40.1% |
| Potawatomi | 99.9 /100 | #69 | Exceptional 40.0% |
| Portuguese | 99.9 /100 | #70 | Exceptional 40.0% |
| Serbians | 99.9 /100 | #71 | Exceptional 39.9% |
| Iroquois | 99.9 /100 | #72 | Exceptional 39.9% |
| Immigrants | Middle Africa | 99.9 /100 | #73 | Exceptional 39.9% |