Dutch West Indian vs Houma Disability Age 5 to 17
COMPARE
Dutch West Indian
Houma
Disability Age 5 to 17
Disability Age 5 to 17 Comparison
Dutch West Indians
Houma
6.7%
DISABILITY AGE 5 TO 17
0.0/ 100
METRIC RATING
330th/ 347
METRIC RANK
9.1%
DISABILITY AGE 5 TO 17
0.0/ 100
METRIC RATING
347th/ 347
METRIC RANK
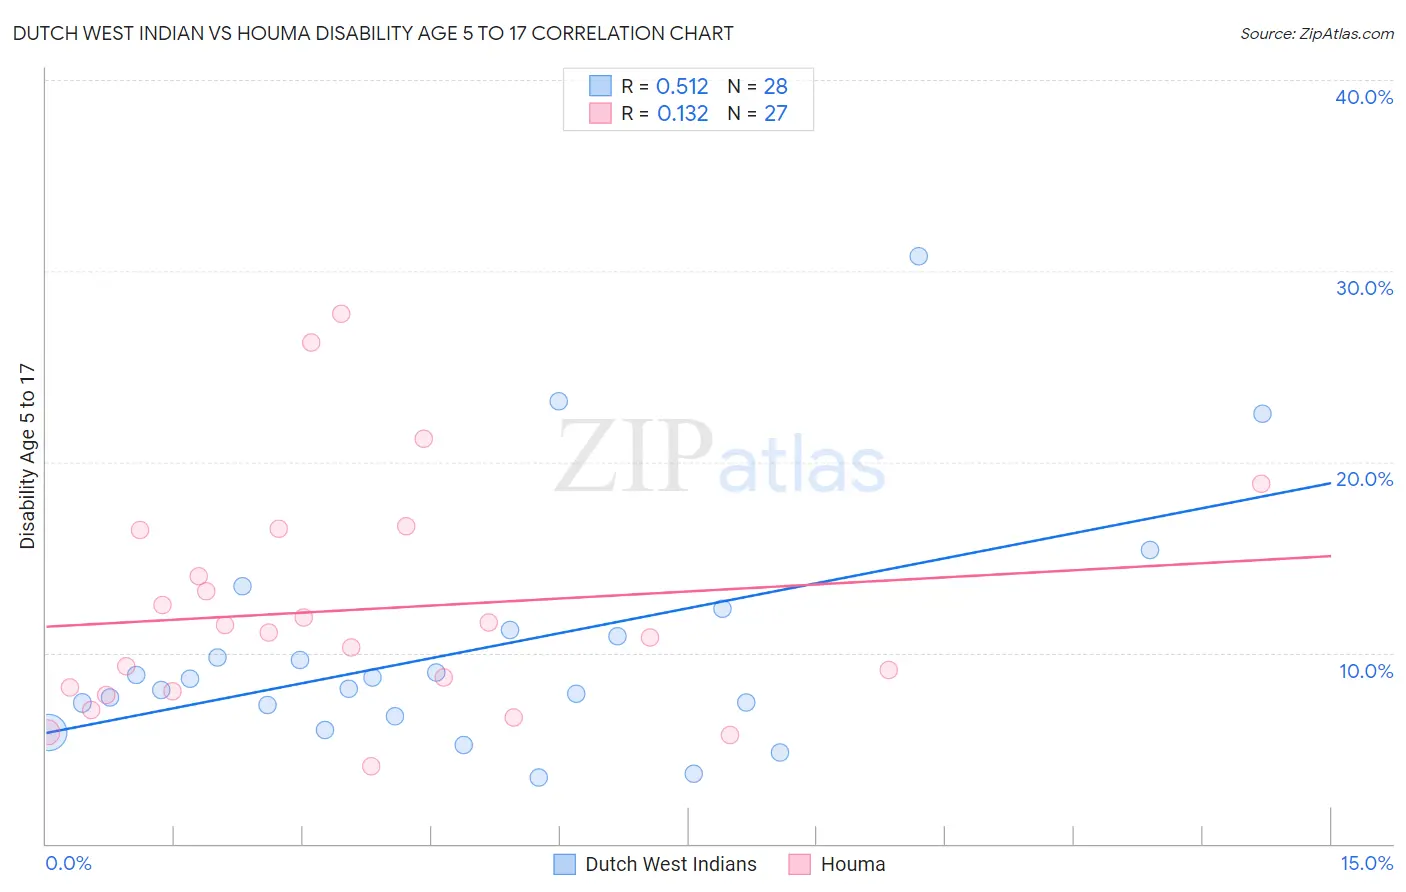
Dutch West Indian vs Houma Disability Age 5 to 17 Correlation Chart
The statistical analysis conducted on geographies consisting of 85,576,125 people shows a substantial positive correlation between the proportion of Dutch West Indians and percentage of population with a disability between the ages 5 and 17 in the United States with a correlation coefficient (R) of 0.512 and weighted average of 6.7%. Similarly, the statistical analysis conducted on geographies consisting of 36,699,710 people shows a poor positive correlation between the proportion of Houma and percentage of population with a disability between the ages 5 and 17 in the United States with a correlation coefficient (R) of 0.132 and weighted average of 9.1%, a difference of 35.0%.
Disability Age 5 to 17 Correlation Summary
| Measurement | Dutch West Indian | Houma |
| Minimum | 3.5% | 4.1% |
| Maximum | 30.8% | 27.8% |
| Range | 27.3% | 23.7% |
| Mean | 10.1% | 12.3% |
| Median | 8.4% | 11.1% |
| Interquartile 25% (IQ1) | 7.0% | 8.0% |
| Interquartile 75% (IQ3) | 11.0% | 16.4% |
| Interquartile Range (IQR) | 4.1% | 8.4% |
| Standard Deviation (Sample) | 6.2% | 6.0% |
| Standard Deviation (Population) | 6.1% | 5.9% |
Demographics Similar to Dutch West Indians and Houma by Disability Age 5 to 17
In terms of disability age 5 to 17, the demographic groups most similar to Dutch West Indians are French Canadian (6.7%, a difference of 0.080%), Immigrants from the Azores (6.7%, a difference of 0.10%), Black/African American (6.8%, a difference of 0.69%), Seminole (6.8%, a difference of 0.74%), and Ottawa (6.8%, a difference of 1.5%). Similarly, the demographic groups most similar to Houma are Puerto Rican (8.3%, a difference of 9.3%), Tsimshian (7.9%, a difference of 14.2%), Cajun (7.2%, a difference of 26.1%), Immigrants from Cabo Verde (7.1%, a difference of 27.0%), and Chippewa (7.1%, a difference of 27.3%).
| Demographics | Rating | Rank | Disability Age 5 to 17 |
| Pennsylvania Germans | 0.0 /100 | #328 | Tragic 6.6% |
| Blackfeet | 0.0 /100 | #329 | Tragic 6.6% |
| Dutch West Indians | 0.0 /100 | #330 | Tragic 6.7% |
| French Canadians | 0.0 /100 | #331 | Tragic 6.7% |
| Immigrants | Azores | 0.0 /100 | #332 | Tragic 6.7% |
| Blacks/African Americans | 0.0 /100 | #333 | Tragic 6.8% |
| Seminole | 0.0 /100 | #334 | Tragic 6.8% |
| Ottawa | 0.0 /100 | #335 | Tragic 6.8% |
| Chickasaw | 0.0 /100 | #336 | Tragic 6.8% |
| Creek | 0.0 /100 | #337 | Tragic 6.9% |
| Iroquois | 0.0 /100 | #338 | Tragic 6.9% |
| Choctaw | 0.0 /100 | #339 | Tragic 6.9% |
| Cherokee | 0.0 /100 | #340 | Tragic 6.9% |
| Cape Verdeans | 0.0 /100 | #341 | Tragic 7.0% |
| Chippewa | 0.0 /100 | #342 | Tragic 7.1% |
| Immigrants | Cabo Verde | 0.0 /100 | #343 | Tragic 7.1% |
| Cajuns | 0.0 /100 | #344 | Tragic 7.2% |
| Tsimshian | 0.0 /100 | #345 | Tragic 7.9% |
| Puerto Ricans | 0.0 /100 | #346 | Tragic 8.3% |
| Houma | 0.0 /100 | #347 | Tragic 9.1% |