Guatemalan vs Yaqui Disability
COMPARE
Guatemalan
Yaqui
Disability
Disability Comparison
Guatemalans
Yaqui
11.6%
DISABILITY
65.1/ 100
METRIC RATING
159th/ 347
METRIC RANK
13.1%
DISABILITY
0.0/ 100
METRIC RATING
291st/ 347
METRIC RANK
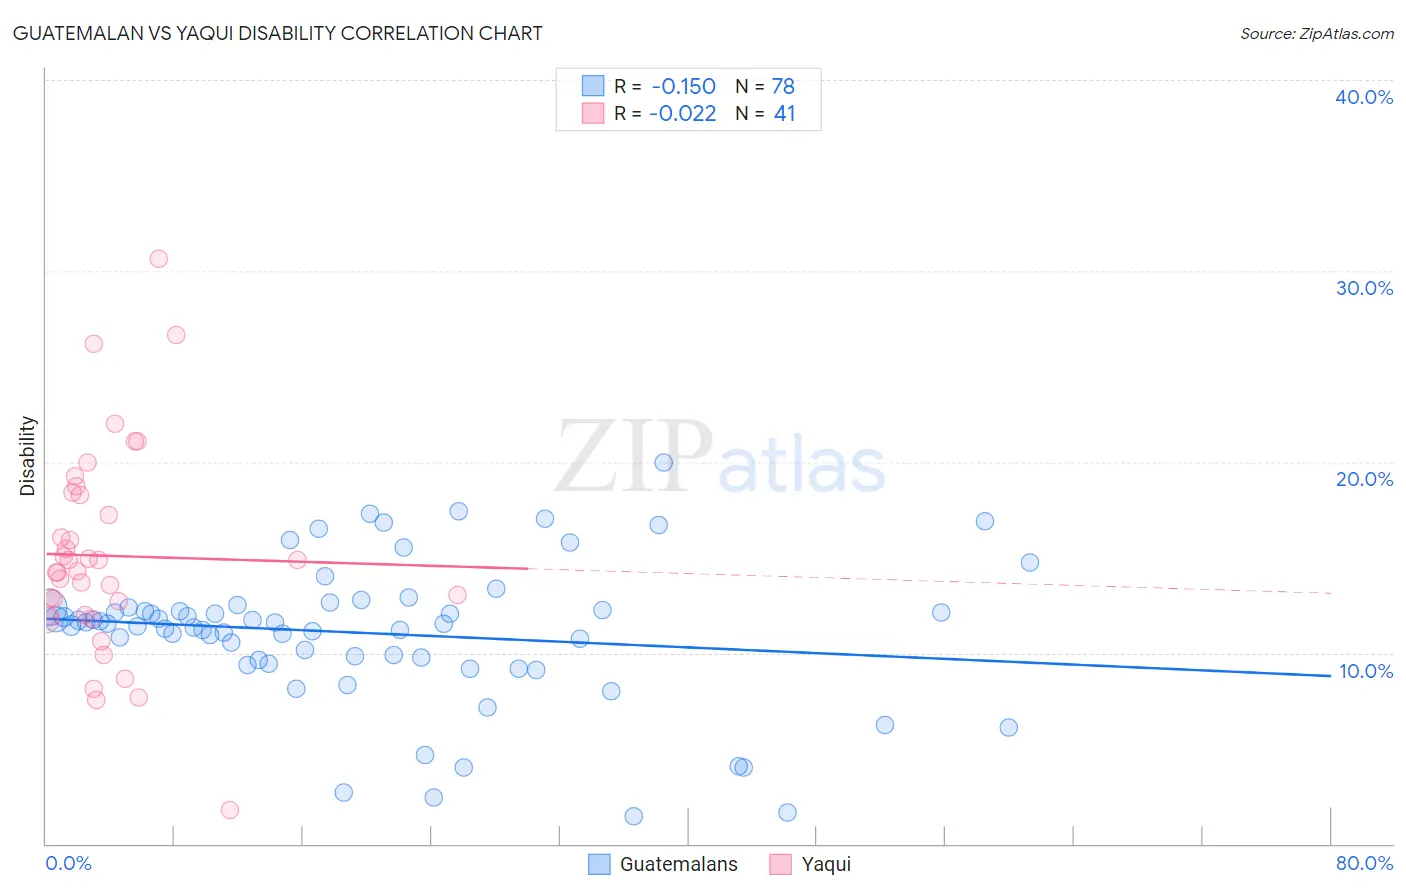
Guatemalan vs Yaqui Disability Correlation Chart
The statistical analysis conducted on geographies consisting of 409,499,513 people shows a poor negative correlation between the proportion of Guatemalans and percentage of population with a disability in the United States with a correlation coefficient (R) of -0.150 and weighted average of 11.6%. Similarly, the statistical analysis conducted on geographies consisting of 107,721,250 people shows no correlation between the proportion of Yaqui and percentage of population with a disability in the United States with a correlation coefficient (R) of -0.022 and weighted average of 13.1%, a difference of 12.3%.
Disability Correlation Summary
| Measurement | Guatemalan | Yaqui |
| Minimum | 1.4% | 1.8% |
| Maximum | 20.0% | 30.6% |
| Range | 18.6% | 28.9% |
| Mean | 11.0% | 15.1% |
| Median | 11.5% | 14.3% |
| Interquartile 25% (IQ1) | 9.6% | 12.0% |
| Interquartile 75% (IQ3) | 12.4% | 18.3% |
| Interquartile Range (IQR) | 2.7% | 6.3% |
| Standard Deviation (Sample) | 3.7% | 5.5% |
| Standard Deviation (Population) | 3.7% | 5.4% |
Similar Demographics by Disability
Demographics Similar to Guatemalans by Disability
In terms of disability, the demographic groups most similar to Guatemalans are Armenian (11.6%, a difference of 0.040%), Immigrants from Barbados (11.6%, a difference of 0.040%), Immigrants from Cuba (11.6%, a difference of 0.11%), Immigrants from Middle Africa (11.6%, a difference of 0.22%), and Immigrants from Fiji (11.6%, a difference of 0.23%).
| Demographics | Rating | Rank | Disability |
| Immigrants | Moldova | 72.0 /100 | #152 | Good 11.6% |
| Immigrants | Ghana | 71.2 /100 | #153 | Good 11.6% |
| Immigrants | Guatemala | 71.1 /100 | #154 | Good 11.6% |
| Immigrants | Netherlands | 69.8 /100 | #155 | Good 11.6% |
| Immigrants | Fiji | 69.5 /100 | #156 | Good 11.6% |
| Immigrants | Middle Africa | 69.5 /100 | #157 | Good 11.6% |
| Armenians | 65.9 /100 | #158 | Good 11.6% |
| Guatemalans | 65.1 /100 | #159 | Good 11.6% |
| Immigrants | Barbados | 64.2 /100 | #160 | Good 11.6% |
| Immigrants | Cuba | 62.8 /100 | #161 | Good 11.6% |
| Immigrants | Haiti | 59.2 /100 | #162 | Average 11.7% |
| Immigrants | Trinidad and Tobago | 58.9 /100 | #163 | Average 11.7% |
| Syrians | 58.5 /100 | #164 | Average 11.7% |
| Cubans | 56.7 /100 | #165 | Average 11.7% |
| Pakistanis | 54.7 /100 | #166 | Average 11.7% |
Demographics Similar to Yaqui by Disability
In terms of disability, the demographic groups most similar to Yaqui are Cheyenne (13.0%, a difference of 0.23%), Slovak (13.0%, a difference of 0.28%), White/Caucasian (13.0%, a difference of 0.29%), African (13.0%, a difference of 0.31%), and Aleut (13.1%, a difference of 0.36%).
| Demographics | Rating | Rank | Disability |
| Welsh | 0.0 /100 | #284 | Tragic 12.9% |
| Crow | 0.0 /100 | #285 | Tragic 12.9% |
| English | 0.0 /100 | #286 | Tragic 13.0% |
| Africans | 0.0 /100 | #287 | Tragic 13.0% |
| Whites/Caucasians | 0.0 /100 | #288 | Tragic 13.0% |
| Slovaks | 0.0 /100 | #289 | Tragic 13.0% |
| Cheyenne | 0.0 /100 | #290 | Tragic 13.0% |
| Yaqui | 0.0 /100 | #291 | Tragic 13.1% |
| Aleuts | 0.0 /100 | #292 | Tragic 13.1% |
| Marshallese | 0.0 /100 | #293 | Tragic 13.1% |
| Celtics | 0.0 /100 | #294 | Tragic 13.1% |
| Immigrants | Nonimmigrants | 0.0 /100 | #295 | Tragic 13.2% |
| Central American Indians | 0.0 /100 | #296 | Tragic 13.2% |
| Hopi | 0.0 /100 | #297 | Tragic 13.2% |
| Alaska Natives | 0.0 /100 | #298 | Tragic 13.2% |