Chilean vs Immigrants from Western Europe Disability
COMPARE
Chilean
Immigrants from Western Europe
Disability
Disability Comparison
Chileans
Immigrants from Western Europe
11.1%
DISABILITY
99.1/ 100
METRIC RATING
82nd/ 347
METRIC RANK
12.0%
DISABILITY
10.1/ 100
METRIC RATING
205th/ 347
METRIC RANK
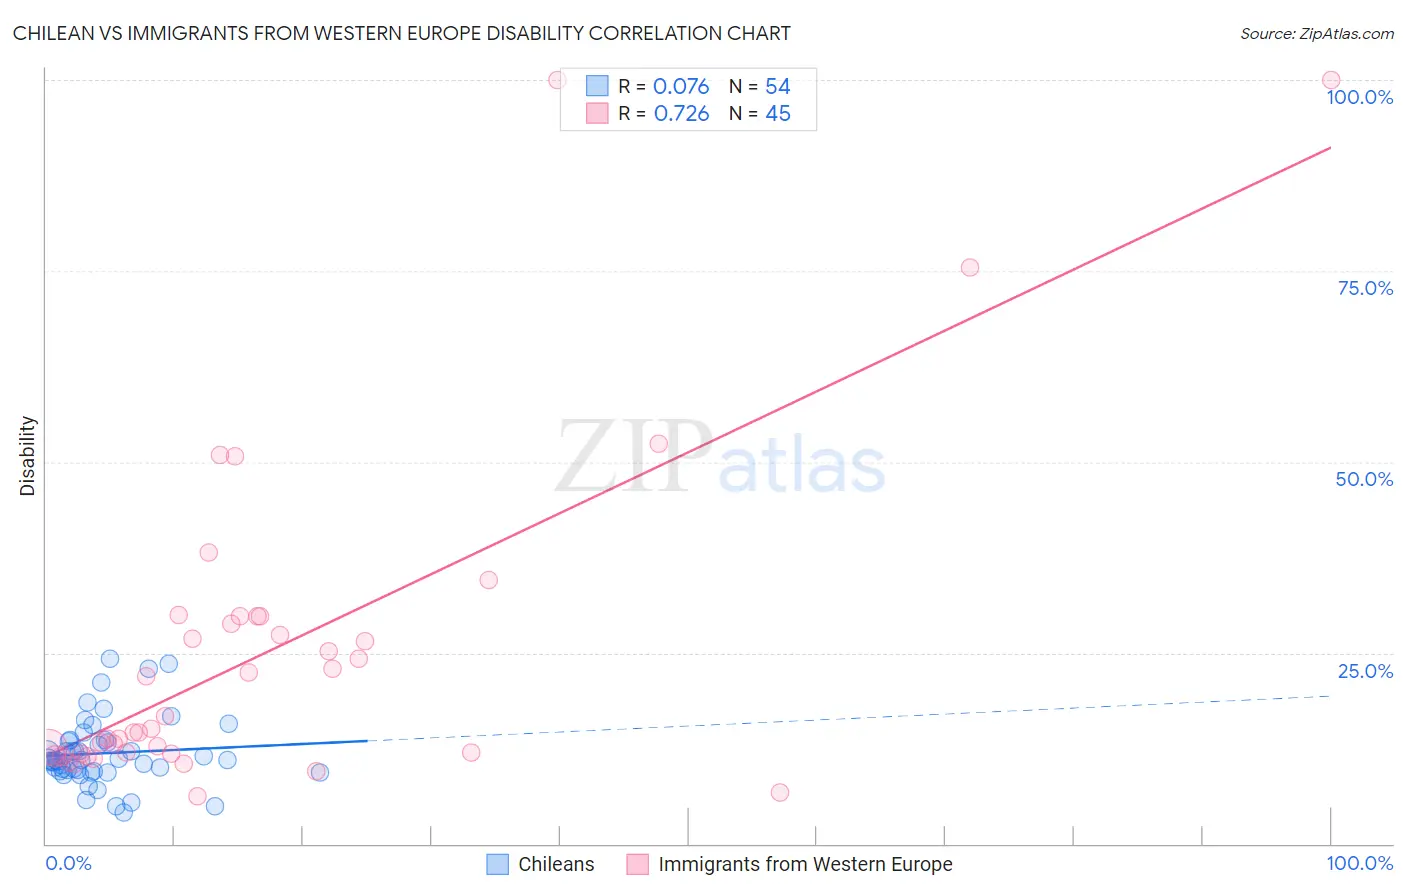
Chilean vs Immigrants from Western Europe Disability Correlation Chart
The statistical analysis conducted on geographies consisting of 256,664,875 people shows a slight positive correlation between the proportion of Chileans and percentage of population with a disability in the United States with a correlation coefficient (R) of 0.076 and weighted average of 11.1%. Similarly, the statistical analysis conducted on geographies consisting of 494,041,803 people shows a strong positive correlation between the proportion of Immigrants from Western Europe and percentage of population with a disability in the United States with a correlation coefficient (R) of 0.726 and weighted average of 12.0%, a difference of 8.0%.
Disability Correlation Summary
| Measurement | Chilean | Immigrants from Western Europe |
| Minimum | 4.1% | 6.3% |
| Maximum | 24.3% | 100.0% |
| Range | 20.2% | 93.7% |
| Mean | 11.9% | 25.2% |
| Median | 10.9% | 15.0% |
| Interquartile 25% (IQ1) | 9.5% | 11.7% |
| Interquartile 75% (IQ3) | 13.5% | 29.8% |
| Interquartile Range (IQR) | 4.0% | 18.0% |
| Standard Deviation (Sample) | 4.4% | 21.6% |
| Standard Deviation (Population) | 4.4% | 21.3% |
Similar Demographics by Disability
Demographics Similar to Chileans by Disability
In terms of disability, the demographic groups most similar to Chileans are Immigrants from Switzerland (11.1%, a difference of 0.030%), Immigrants from Poland (11.1%, a difference of 0.050%), Immigrants from Sierra Leone (11.1%, a difference of 0.050%), Immigrants from Belarus (11.1%, a difference of 0.19%), and Immigrants from Russia (11.1%, a difference of 0.20%).
| Demographics | Rating | Rank | Disability |
| Immigrants | Vietnam | 99.4 /100 | #75 | Exceptional 11.0% |
| Sierra Leoneans | 99.3 /100 | #76 | Exceptional 11.0% |
| Immigrants | Belgium | 99.3 /100 | #77 | Exceptional 11.0% |
| Immigrants | Cameroon | 99.3 /100 | #78 | Exceptional 11.1% |
| Immigrants | Jordan | 99.3 /100 | #79 | Exceptional 11.1% |
| Immigrants | Ireland | 99.3 /100 | #80 | Exceptional 11.1% |
| Immigrants | Poland | 99.1 /100 | #81 | Exceptional 11.1% |
| Chileans | 99.1 /100 | #82 | Exceptional 11.1% |
| Immigrants | Switzerland | 99.0 /100 | #83 | Exceptional 11.1% |
| Immigrants | Sierra Leone | 99.0 /100 | #84 | Exceptional 11.1% |
| Immigrants | Belarus | 98.9 /100 | #85 | Exceptional 11.1% |
| Immigrants | Russia | 98.9 /100 | #86 | Exceptional 11.1% |
| Palestinians | 98.9 /100 | #87 | Exceptional 11.1% |
| Immigrants | Romania | 98.5 /100 | #88 | Exceptional 11.2% |
| Immigrants | South Africa | 98.2 /100 | #89 | Exceptional 11.2% |
Demographics Similar to Immigrants from Western Europe by Disability
In terms of disability, the demographic groups most similar to Immigrants from Western Europe are Immigrants from Senegal (12.0%, a difference of 0.080%), Immigrants from Thailand (12.0%, a difference of 0.10%), Immigrants from Caribbean (12.0%, a difference of 0.12%), British West Indian (12.0%, a difference of 0.16%), and Mexican American Indian (12.0%, a difference of 0.16%).
| Demographics | Rating | Rank | Disability |
| Ukrainians | 14.7 /100 | #198 | Poor 11.9% |
| Immigrants | Panama | 14.6 /100 | #199 | Poor 11.9% |
| Belizeans | 12.8 /100 | #200 | Poor 11.9% |
| Assyrians/Chaldeans/Syriacs | 12.6 /100 | #201 | Poor 11.9% |
| Immigrants | England | 12.0 /100 | #202 | Poor 12.0% |
| British West Indians | 11.5 /100 | #203 | Poor 12.0% |
| Mexican American Indians | 11.4 /100 | #204 | Poor 12.0% |
| Immigrants | Western Europe | 10.1 /100 | #205 | Poor 12.0% |
| Immigrants | Senegal | 9.4 /100 | #206 | Tragic 12.0% |
| Immigrants | Thailand | 9.3 /100 | #207 | Tragic 12.0% |
| Immigrants | Caribbean | 9.1 /100 | #208 | Tragic 12.0% |
| Danes | 8.7 /100 | #209 | Tragic 12.0% |
| Czechs | 7.9 /100 | #210 | Tragic 12.0% |
| Immigrants | Cambodia | 7.3 /100 | #211 | Tragic 12.0% |
| Austrians | 7.2 /100 | #212 | Tragic 12.0% |