Dominican vs Immigrants from Western Europe 3rd Grade

COMPARE

Dominican
Race
Ancestry
AfghanAfricanAlaska NativeAlaskan AthabascanAlbanianAleutAlsatianAmericanApacheArabArapahoArgentineanArmenianAssyrian/Chaldean/SyriacAustralianAustrianBahamianBangladeshiBarbadianBasqueBelgianBelizeanBermudanBhutaneseBlackfeetBolivianBrazilianBritishBritish West IndianBulgarianBurmeseCajunCambodianCanadianCape VerdeanCarpatho RusynCelticCentral AmericanCentral American IndianCherokeeCheyenneChickasawChileanChineseChippewaChoctawColombianColvilleComancheCosta RicanCreeCreekCroatianCrowCubanCypriotCzechCzechoslovakianDanishDelawareDominicanDutchDutch West IndianEastern EuropeanEcuadorianEgyptianEnglishEstonianEthiopianEuropeanFijianFilipinoFinnishFrenchFrench American IndianFrench CanadianGermanGerman RussianGhanaianGreekGuamanian/ChamorroGuatemalanGuyaneseHaitianHmongHonduranHopiHoumaHungarianIcelanderIndian (Asian)IndonesianInupiatIranianIraqiIrishIroquoisIsraeliItalianJamaicanJapaneseJordanianKenyanKiowaKoreanLaotianLatvianLebaneseLiberianLithuanianLumbeeLuxembourgerMacedonianMalaysianMalteseMarshalleseMenomineeMexicanMexican American IndianMongolianMoroccanNative HawaiianNavajoNepaleseNew ZealanderNicaraguanNigerianNorthern EuropeanNorwegianOkinawanOsageOttawaPaiutePakistaniPalestinianPanamanianParaguayanPennsylvania GermanPeruvianPimaPolishPortuguesePotawatomiPuebloPuerto RicanPuget Sound SalishRomanianRussianSalvadoranSamoanScandinavianScotch-IrishScottishSeminoleSenegaleseSerbianShoshoneSierra LeoneanSiouxSlavicSlovakSloveneSomaliSouth AfricanSouth AmericanSouth American IndianSoviet UnionSpaniardSpanishSpanish AmericanSpanish American IndianSri LankanSubsaharan AfricanSudaneseSwedishSwissSyrianTaiwaneseThaiTlingit-HaidaTohono O'OdhamTonganTrinidadian and TobagonianTsimshianTurkishU.S. Virgin IslanderUgandanUkrainianUruguayanUteVenezuelanVietnameseWelshWest IndianYakamaYaquiYugoslavianYumanYup'ikZimbabwean
Immigration
NonimmigrantsImmigrantsAfghanistanAfricaAlbaniaArgentinaArmeniaAsiaAustraliaAustriaBahamasBangladeshBarbadosBelarusBelgiumBelizeBoliviaBosnia and HerzegovinaBrazilBulgariaBurma/MyanmarCabo VerdeCambodiaCameroonCanadaCaribbeanCentral AmericaChileChinaColombiaCongoCosta RicaCroatiaCubaCzechoslovakiaDenmarkDominicaDominican RepublicEastern AfricaEastern AsiaEastern EuropeEcuadorEgyptEl SalvadorEnglandEritreaEthiopiaEuropeFijiFranceGermanyGhanaGreeceGrenadaGuatemalaGuyanaHaitiHondurasHong KongHungaryIndiaIndonesiaIranIraqIrelandIsraelItalyJamaicaJapanJordanKazakhstanKenyaKoreaKuwaitLaosLatin AmericaLatviaLebanonLiberiaLithuaniaMalaysiaMexicoMicronesiaMiddle AfricaMoldovaMoroccoNepalNetherlandsNicaraguaNigeriaNorth AmericaNorth MacedoniaNorthern AfricaNorthern EuropeNorwayOceaniaPakistanPanamaPeruPhilippinesPolandPortugalRomaniaRussiaSaudi ArabiaScotlandSenegalSerbiaSierra LeoneSingaporeSomaliaSouth AfricaSouth AmericaSouth Central AsiaSouth Eastern AsiaSouthern EuropeSpainSri LankaSt. Vincent and the GrenadinesSudanSwedenSwitzerlandSyriaTaiwanThailandTrinidad and TobagoTurkeyUgandaUkraineUruguayUzbekistanVenezuelaVietnamWest IndiesWestern AfricaWestern AsiaYemenZaireZimbabweAzores
Immigrants from Western Europe
Race
Ancestry
AfghanAfricanAlaska NativeAlaskan AthabascanAlbanianAleutAlsatianAmericanApacheArabArapahoArgentineanArmenianAssyrian/Chaldean/SyriacAustralianAustrianBahamianBangladeshiBarbadianBasqueBelgianBelizeanBermudanBhutaneseBlackfeetBolivianBrazilianBritishBritish West IndianBulgarianBurmeseCajunCambodianCanadianCape VerdeanCarpatho RusynCelticCentral AmericanCentral American IndianCherokeeCheyenneChickasawChileanChineseChippewaChoctawColombianColvilleComancheCosta RicanCreeCreekCroatianCrowCubanCypriotCzechCzechoslovakianDanishDelawareDutchDutch West IndianEastern EuropeanEcuadorianEgyptianEnglishEstonianEthiopianEuropeanFijianFilipinoFinnishFrenchFrench American IndianFrench CanadianGermanGerman RussianGhanaianGreekGuamanian/ChamorroGuatemalanGuyaneseHaitianHmongHonduranHopiHoumaHungarianIcelanderIndian (Asian)IndonesianInupiatIranianIraqiIrishIroquoisIsraeliItalianJamaicanJapaneseJordanianKenyanKiowaKoreanLaotianLatvianLebaneseLiberianLithuanianLumbeeLuxembourgerMacedonianMalaysianMalteseMarshalleseMenomineeMexicanMexican American IndianMongolianMoroccanNative HawaiianNavajoNepaleseNew ZealanderNicaraguanNigerianNorthern EuropeanNorwegianOkinawanOsageOttawaPaiutePakistaniPalestinianPanamanianParaguayanPennsylvania GermanPeruvianPimaPolishPortuguesePotawatomiPuebloPuerto RicanPuget Sound SalishRomanianRussianSalvadoranSamoanScandinavianScotch-IrishScottishSeminoleSenegaleseSerbianShoshoneSierra LeoneanSiouxSlavicSlovakSloveneSomaliSouth AfricanSouth AmericanSouth American IndianSoviet UnionSpaniardSpanishSpanish AmericanSpanish American IndianSri LankanSubsaharan AfricanSudaneseSwedishSwissSyrianTaiwaneseThaiTlingit-HaidaTohono O'OdhamTonganTrinidadian and TobagonianTsimshianTurkishU.S. Virgin IslanderUgandanUkrainianUruguayanUteVenezuelanVietnameseWelshWest IndianYakamaYaquiYugoslavianYumanYup'ikZimbabwean
Immigration
NonimmigrantsImmigrantsAfghanistanAfricaAlbaniaArgentinaArmeniaAsiaAustraliaAustriaBahamasBangladeshBarbadosBelarusBelgiumBelizeBoliviaBosnia and HerzegovinaBrazilBulgariaBurma/MyanmarCabo VerdeCambodiaCameroonCanadaCaribbeanCentral AmericaChileChinaColombiaCongoCosta RicaCroatiaCubaCzechoslovakiaDenmarkDominicaDominican RepublicEastern AfricaEastern AsiaEastern EuropeEcuadorEgyptEl SalvadorEnglandEritreaEthiopiaEuropeFijiFranceGermanyGhanaGreeceGrenadaGuatemalaGuyanaHaitiHondurasHong KongHungaryIndiaIndonesiaIranIraqIrelandIsraelItalyJamaicaJapanJordanKazakhstanKenyaKoreaKuwaitLaosLatin AmericaLatviaLebanonLiberiaLithuaniaMalaysiaMexicoMicronesiaMiddle AfricaMoldovaMoroccoNepalNetherlandsNicaraguaNigeriaNorth AmericaNorth MacedoniaNorthern AfricaNorthern EuropeNorwayOceaniaPakistanPanamaPeruPhilippinesPolandPortugalRomaniaRussiaSaudi ArabiaScotlandSenegalSerbiaSierra LeoneSingaporeSomaliaSouth AfricaSouth AmericaSouth Central AsiaSouth Eastern AsiaSouthern EuropeSpainSri LankaSt. Vincent and the GrenadinesSudanSwedenSwitzerlandSyriaTaiwanThailandTrinidad and TobagoTurkeyUgandaUkraineUruguayUzbekistanVenezuelaVietnamWest IndiesWestern AfricaWestern AsiaWestern EuropeYemenZaireZimbabweAzores
3rd Grade
Income
Poverty
Unemployment
Labor Participation
Family Structure
Vehicle Availability
Education Level
Disability

3rd Grade Comparison

Dominicans

Immigrants from Western Europe

Tragic
Exceptional
96.4%
3RD GRADE
0.0/ 100
METRIC RATING
324th/ 347
METRIC RANK
98.1%
3RD GRADE
98.7/ 100
METRIC RATING
93rd/ 347
METRIC RANK

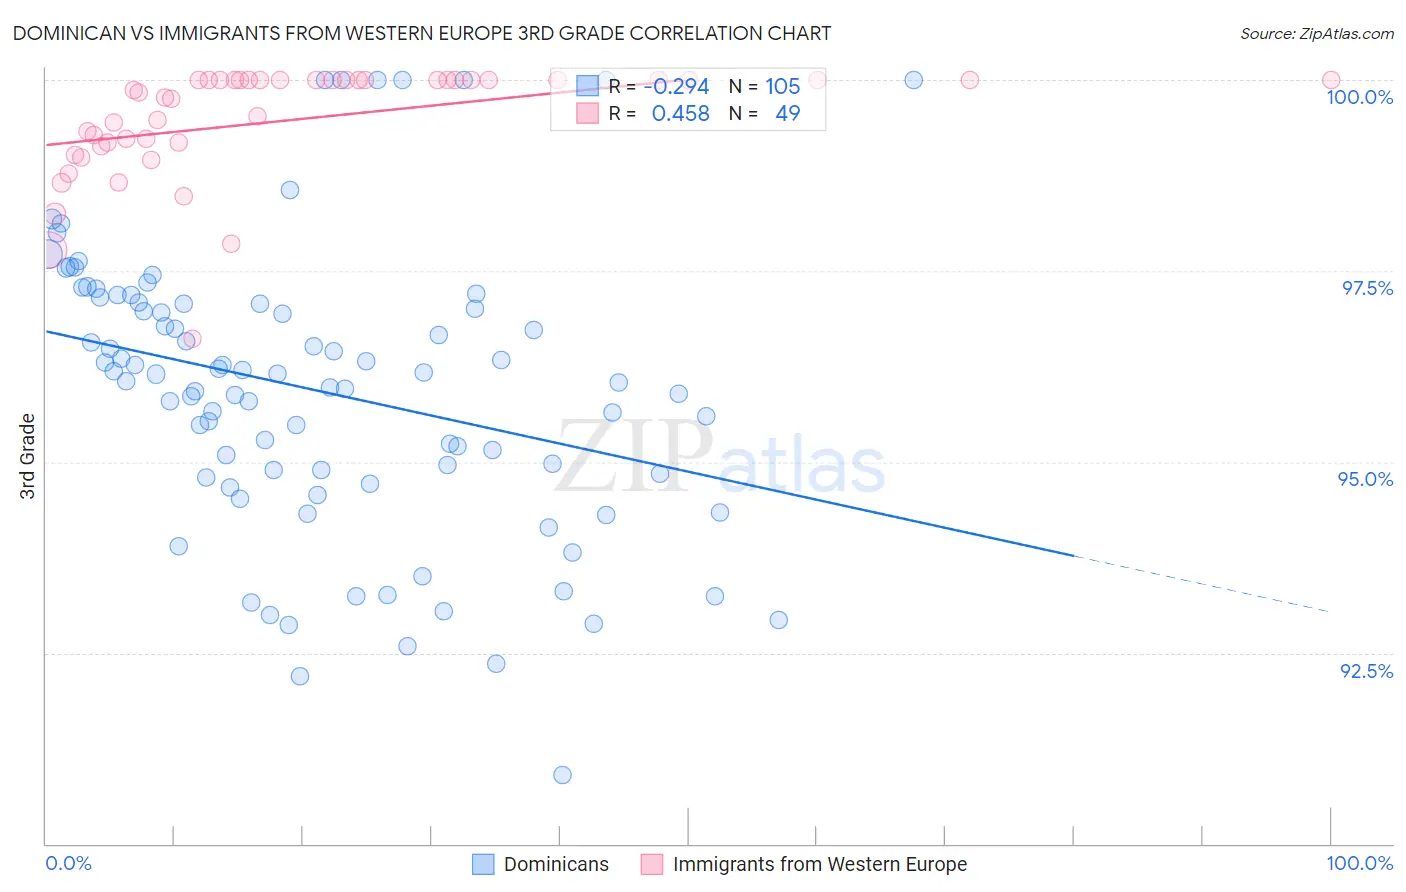
Dominican vs Immigrants from Western Europe 3rd Grade Correlation Chart

The statistical analysis conducted on geographies consisting of 355,142,603 people shows a weak negative correlation between the proportion of Dominicans and percentage of population with at least 3rd grade education in the United States with a correlation coefficient (R) of -0.294 and weighted average of 96.4%. Similarly, the statistical analysis conducted on geographies consisting of 494,080,297 people shows a moderate positive correlation between the proportion of Immigrants from Western Europe and percentage of population with at least 3rd grade education in the United States with a correlation coefficient (R) of 0.458 and weighted average of 98.1%, a difference of 1.8%.
Dominican vs Immigrants from Western Europe 3rd Grade

3rd Grade Correlation Summary

MeasurementDominicanImmigrants from Western Europe
Minimum90.9%96.6%
Maximum100.0%100.0%
Range9.1%3.4%
Mean95.9%99.5%
Median96.1%99.9%
Interquartile 25% (IQ1)94.8%99.2%
Interquartile 75% (IQ3)97.1%100.0%
Interquartile Range (IQR)2.3%0.84%
Standard Deviation (Sample)1.9%0.74%
Standard Deviation (Population)1.9%0.73%

Similar Demographics by 3rd Grade

Demographics Similar to Dominicans by 3rd Grade

In terms of 3rd grade, the demographic groups most similar to Dominicans are Mexican American Indian (96.4%, a difference of 0.010%), Immigrants from Vietnam (96.4%, a difference of 0.050%), Japanese (96.4%, a difference of 0.060%), Bangladeshi (96.3%, a difference of 0.060%), and Honduran (96.5%, a difference of 0.080%).
DemographicsRating | Rank3rd Grade
Immigrants | Bangladesh
0.0
/100
|
#317
Tragic
96.6%
Hispanics or Latinos
0.0
/100
|
#318
Tragic
96.5%
Vietnamese
0.0
/100
|
#319
Tragic
96.5%
Immigrants | Nicaragua
0.0
/100
|
#320
Tragic
96.5%
Indonesians
0.0
/100
|
#321
Tragic
96.5%
Immigrants | Belize
0.0
/100
|
#322
Tragic
96.5%
Hondurans
0.0
/100
|
#323
Tragic
96.5%
Dominicans
0.0
/100
|
#324
Tragic
96.4%
Mexican American Indians
0.0
/100
|
#325
Tragic
96.4%
Immigrants | Vietnam
0.0
/100
|
#326
Tragic
96.4%
Japanese
0.0
/100
|
#327
Tragic
96.4%
Bangladeshis
0.0
/100
|
#328
Tragic
96.3%
Immigrants | Honduras
0.0
/100
|
#329
Tragic
96.3%
Immigrants | Armenia
0.0
/100
|
#330
Tragic
96.3%
Immigrants | Latin America
0.0
/100
|
#331
Tragic
96.2%

Demographics Similar to Immigrants from Western Europe by 3rd Grade

In terms of 3rd grade, the demographic groups most similar to Immigrants from Western Europe are Hopi (98.1%, a difference of 0.0%), Immigrants from South Africa (98.1%, a difference of 0.0%), Potawatomi (98.1%, a difference of 0.010%), Immigrants from Denmark (98.1%, a difference of 0.010%), and Immigrants from India (98.1%, a difference of 0.010%).
DemographicsRating | Rank3rd Grade
Potawatomi
98.9
/100
|
#86
Exceptional
98.1%
Immigrants | Denmark
98.8
/100
|
#87
Exceptional
98.1%
Immigrants | India
98.8
/100
|
#88
Exceptional
98.1%
Delaware
98.8
/100
|
#89
Exceptional
98.1%
Zimbabweans
98.8
/100
|
#90
Exceptional
98.1%
Hopi
98.7
/100
|
#91
Exceptional
98.1%
Immigrants | South Africa
98.7
/100
|
#92
Exceptional
98.1%
Immigrants | Western Europe
98.7
/100
|
#93
Exceptional
98.1%
Immigrants | Germany
98.4
/100
|
#94
Exceptional
98.1%
Cypriots
98.4
/100
|
#95
Exceptional
98.1%
Immigrants | Ireland
98.2
/100
|
#96
Exceptional
98.1%
South Africans
98.2
/100
|
#97
Exceptional
98.1%
Choctaw
98.0
/100
|
#98
Exceptional
98.1%
Romanians
98.0
/100
|
#99
Exceptional
98.1%
Cree
97.9
/100
|
#100
Exceptional
98.1%