Jordanian vs Korean Self-Care Disability
COMPARE
Jordanian
Korean
Self-Care Disability
Self-Care Disability Comparison
Jordanians
Koreans
2.3%
SELF-CARE DISABILITY
99.7/ 100
METRIC RATING
47th/ 347
METRIC RANK
2.5%
SELF-CARE DISABILITY
15.5/ 100
METRIC RATING
196th/ 347
METRIC RANK
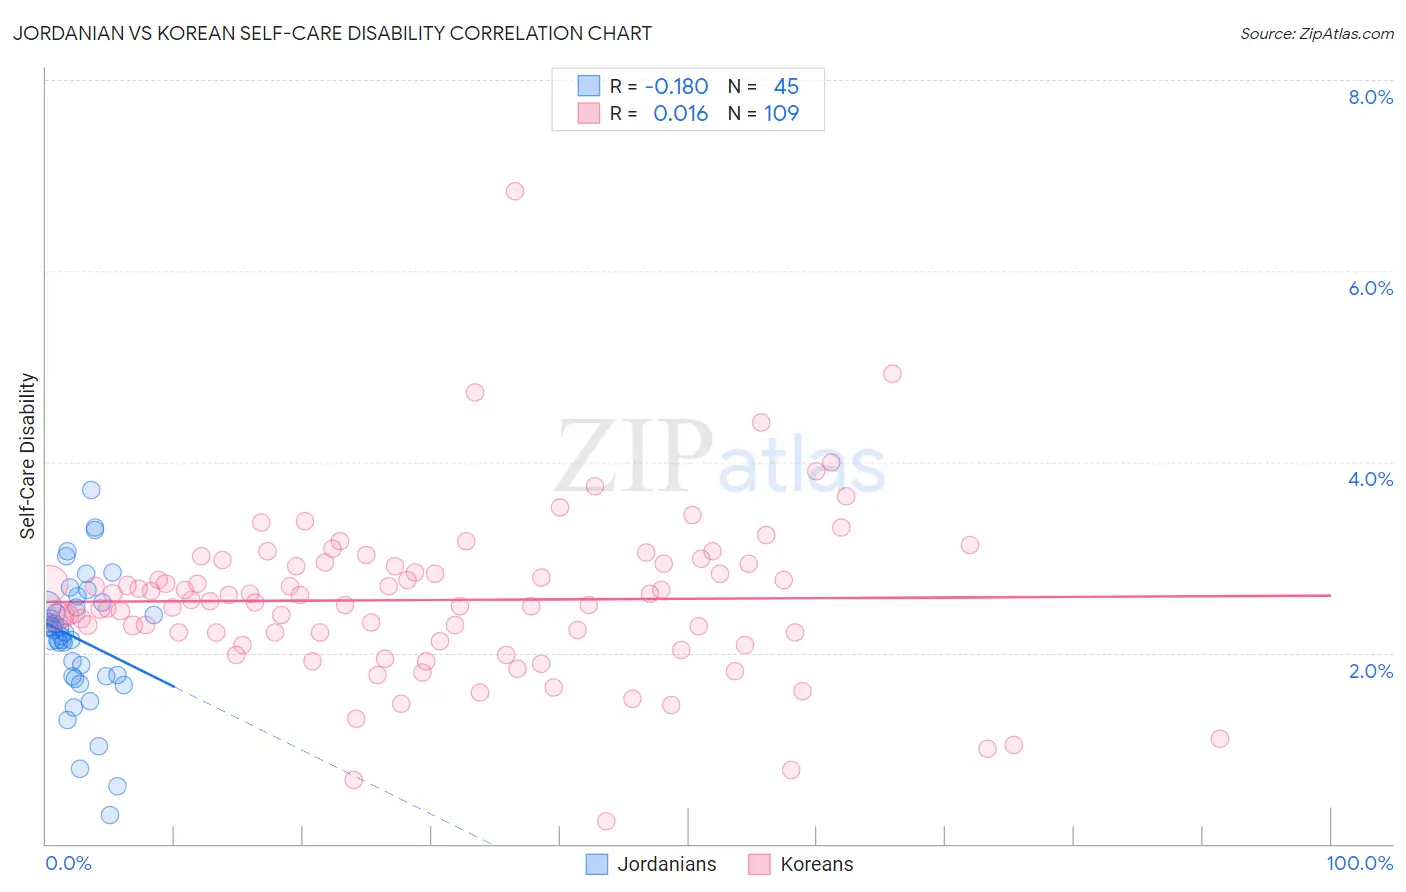
Jordanian vs Korean Self-Care Disability Correlation Chart
The statistical analysis conducted on geographies consisting of 166,373,634 people shows a poor negative correlation between the proportion of Jordanians and percentage of population with self-care disability in the United States with a correlation coefficient (R) of -0.180 and weighted average of 2.3%. Similarly, the statistical analysis conducted on geographies consisting of 509,747,952 people shows no correlation between the proportion of Koreans and percentage of population with self-care disability in the United States with a correlation coefficient (R) of 0.016 and weighted average of 2.5%, a difference of 9.8%.
Self-Care Disability Correlation Summary
| Measurement | Jordanian | Korean |
| Minimum | 0.31% | 0.24% |
| Maximum | 3.7% | 6.8% |
| Range | 3.4% | 6.6% |
| Mean | 2.1% | 2.6% |
| Median | 2.2% | 2.5% |
| Interquartile 25% (IQ1) | 1.8% | 2.2% |
| Interquartile 75% (IQ3) | 2.5% | 2.9% |
| Interquartile Range (IQR) | 0.75% | 0.77% |
| Standard Deviation (Sample) | 0.69% | 0.86% |
| Standard Deviation (Population) | 0.68% | 0.86% |
Similar Demographics by Self-Care Disability
Demographics Similar to Jordanians by Self-Care Disability
In terms of self-care disability, the demographic groups most similar to Jordanians are Immigrants from Malaysia (2.3%, a difference of 0.040%), Latvian (2.3%, a difference of 0.22%), Czech (2.3%, a difference of 0.23%), Immigrants from Brazil (2.3%, a difference of 0.24%), and Norwegian (2.3%, a difference of 0.31%).
| Demographics | Rating | Rank | Self-Care Disability |
| Iranians | 99.8 /100 | #40 | Exceptional 2.3% |
| Immigrants | Sudan | 99.8 /100 | #41 | Exceptional 2.3% |
| Immigrants | Uganda | 99.8 /100 | #42 | Exceptional 2.3% |
| Immigrants | Pakistan | 99.8 /100 | #43 | Exceptional 2.3% |
| Immigrants | South Africa | 99.8 /100 | #44 | Exceptional 2.3% |
| Norwegians | 99.8 /100 | #45 | Exceptional 2.3% |
| Czechs | 99.8 /100 | #46 | Exceptional 2.3% |
| Jordanians | 99.7 /100 | #47 | Exceptional 2.3% |
| Immigrants | Malaysia | 99.7 /100 | #48 | Exceptional 2.3% |
| Latvians | 99.7 /100 | #49 | Exceptional 2.3% |
| Immigrants | Brazil | 99.7 /100 | #50 | Exceptional 2.3% |
| Kenyans | 99.7 /100 | #51 | Exceptional 2.3% |
| Immigrants | Serbia | 99.6 /100 | #52 | Exceptional 2.3% |
| Australians | 99.6 /100 | #53 | Exceptional 2.3% |
| Argentineans | 99.6 /100 | #54 | Exceptional 2.3% |
Demographics Similar to Koreans by Self-Care Disability
In terms of self-care disability, the demographic groups most similar to Koreans are Immigrants from Southern Europe (2.5%, a difference of 0.010%), Crow (2.5%, a difference of 0.030%), Immigrants (2.5%, a difference of 0.050%), Immigrants from Ghana (2.5%, a difference of 0.070%), and Immigrants from Germany (2.5%, a difference of 0.20%).
| Demographics | Rating | Rank | Self-Care Disability |
| Immigrants | Eastern Europe | 28.0 /100 | #189 | Fair 2.5% |
| Sioux | 24.6 /100 | #190 | Fair 2.5% |
| Moroccans | 22.9 /100 | #191 | Fair 2.5% |
| Soviet Union | 22.2 /100 | #192 | Fair 2.5% |
| Ukrainians | 21.4 /100 | #193 | Fair 2.5% |
| Immigrants | Germany | 17.9 /100 | #194 | Poor 2.5% |
| Immigrants | Southern Europe | 15.6 /100 | #195 | Poor 2.5% |
| Koreans | 15.5 /100 | #196 | Poor 2.5% |
| Crow | 15.2 /100 | #197 | Poor 2.5% |
| Immigrants | Immigrants | 15.0 /100 | #198 | Poor 2.5% |
| Immigrants | Ghana | 14.7 /100 | #199 | Poor 2.5% |
| Immigrants | Western Africa | 13.3 /100 | #200 | Poor 2.5% |
| Immigrants | South Eastern Asia | 12.9 /100 | #201 | Poor 2.5% |
| Slovaks | 12.6 /100 | #202 | Poor 2.5% |
| Immigrants | Lebanon | 12.4 /100 | #203 | Poor 2.5% |