Blackfeet vs Korean Self-Care Disability
COMPARE
Blackfeet
Korean
Self-Care Disability
Self-Care Disability Comparison
Blackfeet
Koreans
2.7%
SELF-CARE DISABILITY
0.0/ 100
METRIC RATING
294th/ 347
METRIC RANK
2.5%
SELF-CARE DISABILITY
15.5/ 100
METRIC RATING
196th/ 347
METRIC RANK
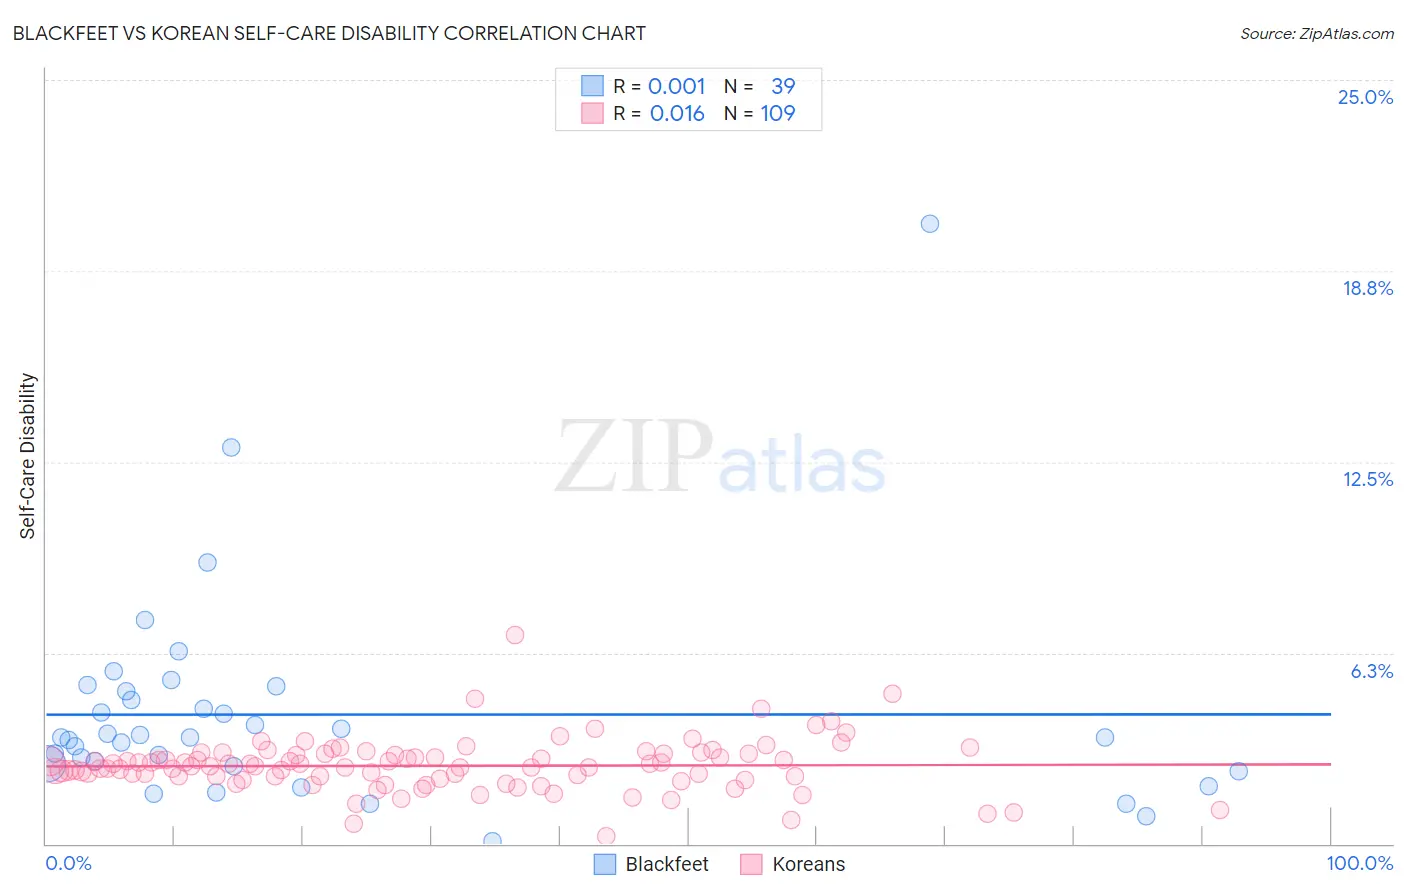
Blackfeet vs Korean Self-Care Disability Correlation Chart
The statistical analysis conducted on geographies consisting of 309,304,153 people shows no correlation between the proportion of Blackfeet and percentage of population with self-care disability in the United States with a correlation coefficient (R) of 0.001 and weighted average of 2.7%. Similarly, the statistical analysis conducted on geographies consisting of 509,747,952 people shows no correlation between the proportion of Koreans and percentage of population with self-care disability in the United States with a correlation coefficient (R) of 0.016 and weighted average of 2.5%, a difference of 9.0%.
Self-Care Disability Correlation Summary
| Measurement | Blackfeet | Korean |
| Minimum | 0.092% | 0.24% |
| Maximum | 20.3% | 6.8% |
| Range | 20.2% | 6.6% |
| Mean | 4.2% | 2.6% |
| Median | 3.5% | 2.5% |
| Interquartile 25% (IQ1) | 2.5% | 2.2% |
| Interquartile 75% (IQ3) | 5.0% | 2.9% |
| Interquartile Range (IQR) | 2.5% | 0.77% |
| Standard Deviation (Sample) | 3.5% | 0.86% |
| Standard Deviation (Population) | 3.5% | 0.86% |
Similar Demographics by Self-Care Disability
Demographics Similar to Blackfeet by Self-Care Disability
In terms of self-care disability, the demographic groups most similar to Blackfeet are Central American Indian (2.7%, a difference of 0.010%), Belizean (2.7%, a difference of 0.010%), Barbadian (2.7%, a difference of 0.14%), Guyanese (2.7%, a difference of 0.16%), and Cuban (2.7%, a difference of 0.43%).
| Demographics | Rating | Rank | Self-Care Disability |
| Immigrants | Jamaica | 0.0 /100 | #287 | Tragic 2.7% |
| Immigrants | Barbados | 0.0 /100 | #288 | Tragic 2.7% |
| Africans | 0.0 /100 | #289 | Tragic 2.7% |
| Cubans | 0.0 /100 | #290 | Tragic 2.7% |
| Guyanese | 0.0 /100 | #291 | Tragic 2.7% |
| Central American Indians | 0.0 /100 | #292 | Tragic 2.7% |
| Belizeans | 0.0 /100 | #293 | Tragic 2.7% |
| Blackfeet | 0.0 /100 | #294 | Tragic 2.7% |
| Barbadians | 0.0 /100 | #295 | Tragic 2.7% |
| Immigrants | Portugal | 0.0 /100 | #296 | Tragic 2.8% |
| West Indians | 0.0 /100 | #297 | Tragic 2.8% |
| Americans | 0.0 /100 | #298 | Tragic 2.8% |
| Immigrants | Guyana | 0.0 /100 | #299 | Tragic 2.8% |
| Immigrants | Fiji | 0.0 /100 | #300 | Tragic 2.8% |
| Pima | 0.0 /100 | #301 | Tragic 2.8% |
Demographics Similar to Koreans by Self-Care Disability
In terms of self-care disability, the demographic groups most similar to Koreans are Immigrants from Southern Europe (2.5%, a difference of 0.010%), Crow (2.5%, a difference of 0.030%), Immigrants (2.5%, a difference of 0.050%), Immigrants from Ghana (2.5%, a difference of 0.070%), and Immigrants from Germany (2.5%, a difference of 0.20%).
| Demographics | Rating | Rank | Self-Care Disability |
| Immigrants | Eastern Europe | 28.0 /100 | #189 | Fair 2.5% |
| Sioux | 24.6 /100 | #190 | Fair 2.5% |
| Moroccans | 22.9 /100 | #191 | Fair 2.5% |
| Soviet Union | 22.2 /100 | #192 | Fair 2.5% |
| Ukrainians | 21.4 /100 | #193 | Fair 2.5% |
| Immigrants | Germany | 17.9 /100 | #194 | Poor 2.5% |
| Immigrants | Southern Europe | 15.6 /100 | #195 | Poor 2.5% |
| Koreans | 15.5 /100 | #196 | Poor 2.5% |
| Crow | 15.2 /100 | #197 | Poor 2.5% |
| Immigrants | Immigrants | 15.0 /100 | #198 | Poor 2.5% |
| Immigrants | Ghana | 14.7 /100 | #199 | Poor 2.5% |
| Immigrants | Western Africa | 13.3 /100 | #200 | Poor 2.5% |
| Immigrants | South Eastern Asia | 12.9 /100 | #201 | Poor 2.5% |
| Slovaks | 12.6 /100 | #202 | Poor 2.5% |
| Immigrants | Lebanon | 12.4 /100 | #203 | Poor 2.5% |