Native Hawaiian vs Alaskan Athabascan Ambulatory Disability
COMPARE
Native Hawaiian
Alaskan Athabascan
Ambulatory Disability
Ambulatory Disability Comparison
Native Hawaiians
Alaskan Athabascans
6.5%
AMBULATORY DISABILITY
1.1/ 100
METRIC RATING
249th/ 347
METRIC RANK
6.9%
AMBULATORY DISABILITY
0.0/ 100
METRIC RATING
296th/ 347
METRIC RANK
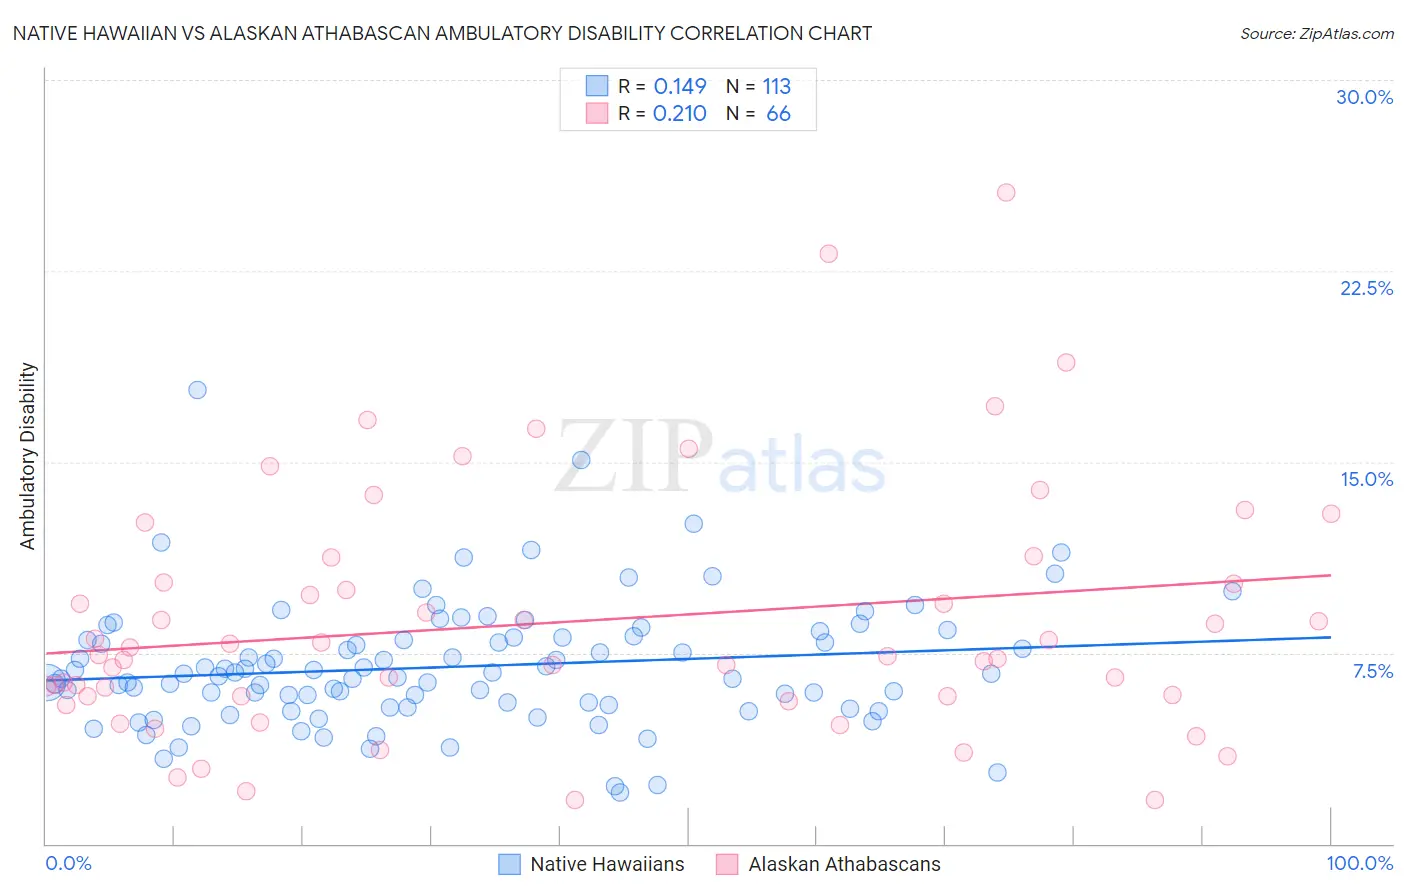
Native Hawaiian vs Alaskan Athabascan Ambulatory Disability Correlation Chart
The statistical analysis conducted on geographies consisting of 331,921,721 people shows a poor positive correlation between the proportion of Native Hawaiians and percentage of population with ambulatory disability in the United States with a correlation coefficient (R) of 0.149 and weighted average of 6.5%. Similarly, the statistical analysis conducted on geographies consisting of 45,819,153 people shows a weak positive correlation between the proportion of Alaskan Athabascans and percentage of population with ambulatory disability in the United States with a correlation coefficient (R) of 0.210 and weighted average of 6.9%, a difference of 6.8%.
Ambulatory Disability Correlation Summary
| Measurement | Native Hawaiian | Alaskan Athabascan |
| Minimum | 2.0% | 1.7% |
| Maximum | 17.8% | 25.6% |
| Range | 15.8% | 23.9% |
| Mean | 6.9% | 8.7% |
| Median | 6.7% | 7.4% |
| Interquartile 25% (IQ1) | 5.4% | 5.8% |
| Interquartile 75% (IQ3) | 8.1% | 10.3% |
| Interquartile Range (IQR) | 2.7% | 4.5% |
| Standard Deviation (Sample) | 2.4% | 4.9% |
| Standard Deviation (Population) | 2.4% | 4.8% |
Similar Demographics by Ambulatory Disability
Demographics Similar to Native Hawaiians by Ambulatory Disability
In terms of ambulatory disability, the demographic groups most similar to Native Hawaiians are Chinese (6.5%, a difference of 0.080%), Hawaiian (6.5%, a difference of 0.26%), Immigrants from Portugal (6.5%, a difference of 0.28%), Immigrants from Cuba (6.5%, a difference of 0.30%), and Armenian (6.5%, a difference of 0.36%).
| Demographics | Rating | Rank | Ambulatory Disability |
| Spaniards | 1.6 /100 | #242 | Tragic 6.5% |
| Germans | 1.5 /100 | #243 | Tragic 6.5% |
| Immigrants | Panama | 1.5 /100 | #244 | Tragic 6.5% |
| Tlingit-Haida | 1.5 /100 | #245 | Tragic 6.5% |
| Armenians | 1.5 /100 | #246 | Tragic 6.5% |
| Immigrants | Cuba | 1.4 /100 | #247 | Tragic 6.5% |
| Immigrants | Portugal | 1.4 /100 | #248 | Tragic 6.5% |
| Native Hawaiians | 1.1 /100 | #249 | Tragic 6.5% |
| Chinese | 1.0 /100 | #250 | Tragic 6.5% |
| Hawaiians | 0.9 /100 | #251 | Tragic 6.5% |
| Immigrants | Bahamas | 0.8 /100 | #252 | Tragic 6.5% |
| Scottish | 0.7 /100 | #253 | Tragic 6.5% |
| Belizeans | 0.7 /100 | #254 | Tragic 6.5% |
| Welsh | 0.6 /100 | #255 | Tragic 6.5% |
| Immigrants | Uzbekistan | 0.6 /100 | #256 | Tragic 6.5% |
Demographics Similar to Alaskan Athabascans by Ambulatory Disability
In terms of ambulatory disability, the demographic groups most similar to Alaskan Athabascans are French American Indian (6.9%, a difference of 0.17%), Immigrants from Grenada (6.9%, a difference of 0.18%), Crow (6.9%, a difference of 0.23%), Cape Verdean (6.9%, a difference of 0.30%), and Puget Sound Salish (6.9%, a difference of 0.31%).
| Demographics | Rating | Rank | Ambulatory Disability |
| Immigrants | Dominica | 0.0 /100 | #289 | Tragic 6.9% |
| Scotch-Irish | 0.0 /100 | #290 | Tragic 6.9% |
| West Indians | 0.0 /100 | #291 | Tragic 6.9% |
| Cheyenne | 0.0 /100 | #292 | Tragic 6.9% |
| Immigrants | St. Vincent and the Grenadines | 0.0 /100 | #293 | Tragic 6.9% |
| Cape Verdeans | 0.0 /100 | #294 | Tragic 6.9% |
| Crow | 0.0 /100 | #295 | Tragic 6.9% |
| Alaskan Athabascans | 0.0 /100 | #296 | Tragic 6.9% |
| French American Indians | 0.0 /100 | #297 | Tragic 6.9% |
| Immigrants | Grenada | 0.0 /100 | #298 | Tragic 6.9% |
| Puget Sound Salish | 0.0 /100 | #299 | Tragic 6.9% |
| Marshallese | 0.0 /100 | #300 | Tragic 6.9% |
| British West Indians | 0.0 /100 | #301 | Tragic 7.0% |
| Immigrants | Armenia | 0.0 /100 | #302 | Tragic 7.0% |
| Africans | 0.0 /100 | #303 | Tragic 7.0% |