Danish vs Alaskan Athabascan Female Poverty Among 25-34 Year Olds
COMPARE
Danish
Alaskan Athabascan
Female Poverty Among 25-34 Year Olds
Female Poverty Among 25-34 Year Olds Comparison
Danes
Alaskan Athabascans
12.8%
FEMALE POVERTY AMONG 25-34 YEAR OLDS
93.9/ 100
METRIC RATING
111th/ 347
METRIC RANK
19.1%
FEMALE POVERTY AMONG 25-34 YEAR OLDS
0.0/ 100
METRIC RATING
328th/ 347
METRIC RANK
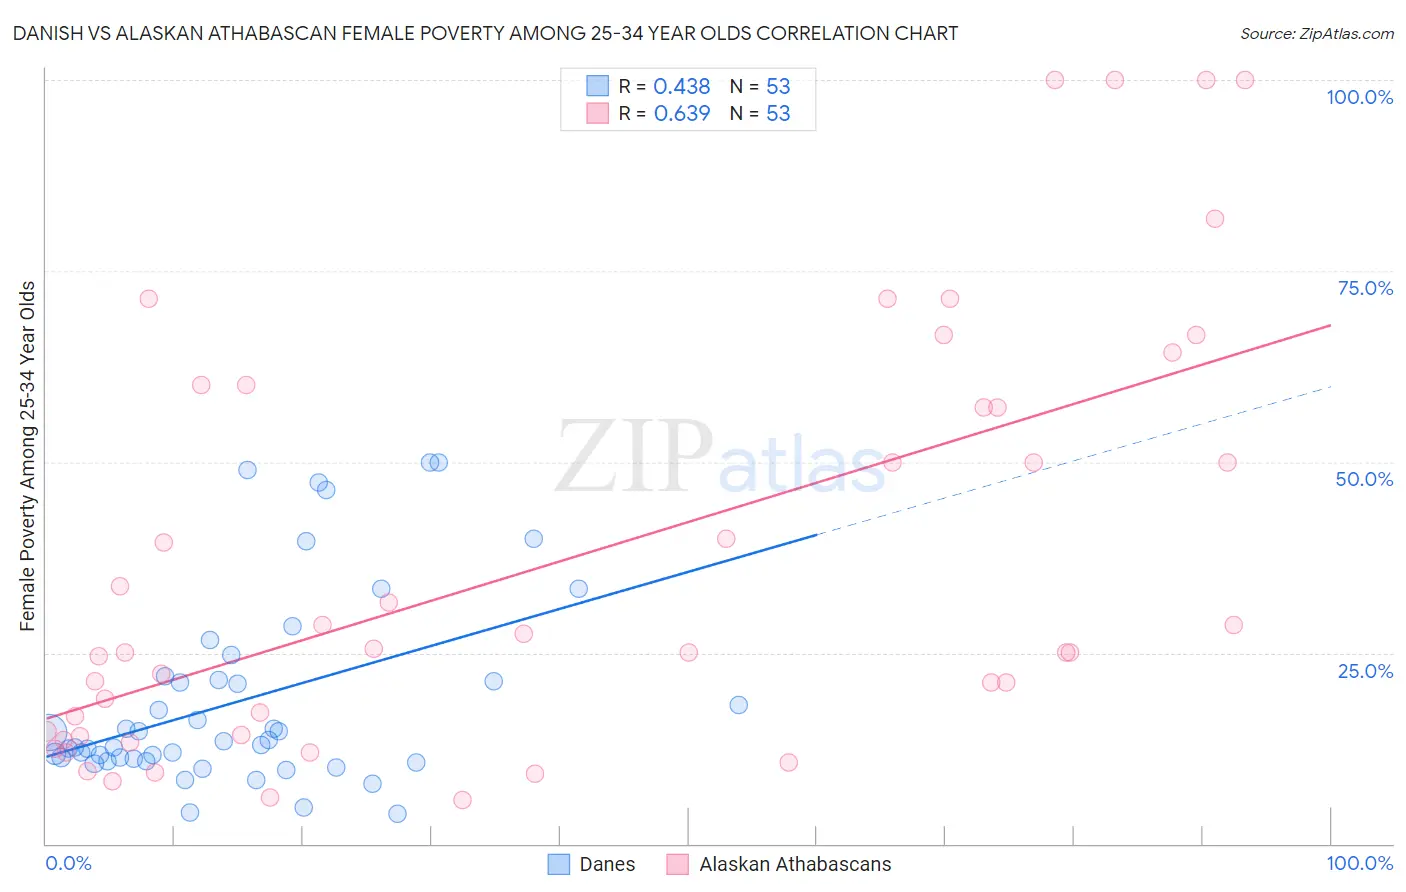
Danish vs Alaskan Athabascan Female Poverty Among 25-34 Year Olds Correlation Chart
The statistical analysis conducted on geographies consisting of 461,269,939 people shows a moderate positive correlation between the proportion of Danes and poverty level among females between the ages 25 and 34 in the United States with a correlation coefficient (R) of 0.438 and weighted average of 12.8%. Similarly, the statistical analysis conducted on geographies consisting of 45,660,440 people shows a significant positive correlation between the proportion of Alaskan Athabascans and poverty level among females between the ages 25 and 34 in the United States with a correlation coefficient (R) of 0.639 and weighted average of 19.1%, a difference of 49.7%.
Female Poverty Among 25-34 Year Olds Correlation Summary
| Measurement | Danish | Alaskan Athabascan |
| Minimum | 3.9% | 5.7% |
| Maximum | 50.0% | 100.0% |
| Range | 46.1% | 94.3% |
| Mean | 18.8% | 37.0% |
| Median | 13.4% | 25.0% |
| Interquartile 25% (IQ1) | 11.0% | 14.2% |
| Interquartile 75% (IQ3) | 21.7% | 58.6% |
| Interquartile Range (IQR) | 10.7% | 44.4% |
| Standard Deviation (Sample) | 12.5% | 27.7% |
| Standard Deviation (Population) | 12.4% | 27.4% |
Similar Demographics by Female Poverty Among 25-34 Year Olds
Demographics Similar to Danes by Female Poverty Among 25-34 Year Olds
In terms of female poverty among 25-34 year olds, the demographic groups most similar to Danes are Immigrants from Morocco (12.8%, a difference of 0.020%), Immigrants from Syria (12.8%, a difference of 0.060%), Australian (12.8%, a difference of 0.070%), Immigrants from Southern Europe (12.8%, a difference of 0.13%), and Immigrants from Peru (12.7%, a difference of 0.15%).
| Demographics | Rating | Rank | Female Poverty Among 25-34 Year Olds |
| Swedes | 95.4 /100 | #104 | Exceptional 12.7% |
| Immigrants | South Africa | 95.3 /100 | #105 | Exceptional 12.7% |
| Tsimshian | 95.1 /100 | #106 | Exceptional 12.7% |
| Poles | 94.9 /100 | #107 | Exceptional 12.7% |
| Immigrants | Norway | 94.4 /100 | #108 | Exceptional 12.7% |
| Immigrants | Peru | 94.3 /100 | #109 | Exceptional 12.7% |
| Australians | 94.1 /100 | #110 | Exceptional 12.8% |
| Danes | 93.9 /100 | #111 | Exceptional 12.8% |
| Immigrants | Morocco | 93.9 /100 | #112 | Exceptional 12.8% |
| Immigrants | Syria | 93.8 /100 | #113 | Exceptional 12.8% |
| Immigrants | Southern Europe | 93.6 /100 | #114 | Exceptional 12.8% |
| Immigrants | Brazil | 93.3 /100 | #115 | Exceptional 12.8% |
| Chileans | 93.2 /100 | #116 | Exceptional 12.8% |
| Immigrants | Kuwait | 93.1 /100 | #117 | Exceptional 12.8% |
| Mongolians | 93.0 /100 | #118 | Exceptional 12.8% |
Demographics Similar to Alaskan Athabascans by Female Poverty Among 25-34 Year Olds
In terms of female poverty among 25-34 year olds, the demographic groups most similar to Alaskan Athabascans are Cheyenne (19.1%, a difference of 0.080%), Creek (19.2%, a difference of 0.25%), Black/African American (18.9%, a difference of 1.0%), Paiute (19.6%, a difference of 2.5%), and Kiowa (19.7%, a difference of 2.9%).
| Demographics | Rating | Rank | Female Poverty Among 25-34 Year Olds |
| Choctaw | 0.0 /100 | #321 | Tragic 18.1% |
| Central American Indians | 0.0 /100 | #322 | Tragic 18.2% |
| Seminole | 0.0 /100 | #323 | Tragic 18.3% |
| Dutch West Indians | 0.0 /100 | #324 | Tragic 18.4% |
| Inupiat | 0.0 /100 | #325 | Tragic 18.5% |
| Blacks/African Americans | 0.0 /100 | #326 | Tragic 18.9% |
| Cheyenne | 0.0 /100 | #327 | Tragic 19.1% |
| Alaskan Athabascans | 0.0 /100 | #328 | Tragic 19.1% |
| Creek | 0.0 /100 | #329 | Tragic 19.2% |
| Paiute | 0.0 /100 | #330 | Tragic 19.6% |
| Kiowa | 0.0 /100 | #331 | Tragic 19.7% |
| Immigrants | Yemen | 0.0 /100 | #332 | Tragic 19.8% |
| Cajuns | 0.0 /100 | #333 | Tragic 19.9% |
| Apache | 0.0 /100 | #334 | Tragic 20.1% |
| Natives/Alaskans | 0.0 /100 | #335 | Tragic 20.3% |