Venezuelan vs Alaskan Athabascan Ambulatory Disability
COMPARE
Venezuelan
Alaskan Athabascan
Ambulatory Disability
Ambulatory Disability Comparison
Venezuelans
Alaskan Athabascans
5.5%
AMBULATORY DISABILITY
99.9/ 100
METRIC RATING
40th/ 347
METRIC RANK
6.9%
AMBULATORY DISABILITY
0.0/ 100
METRIC RATING
296th/ 347
METRIC RANK
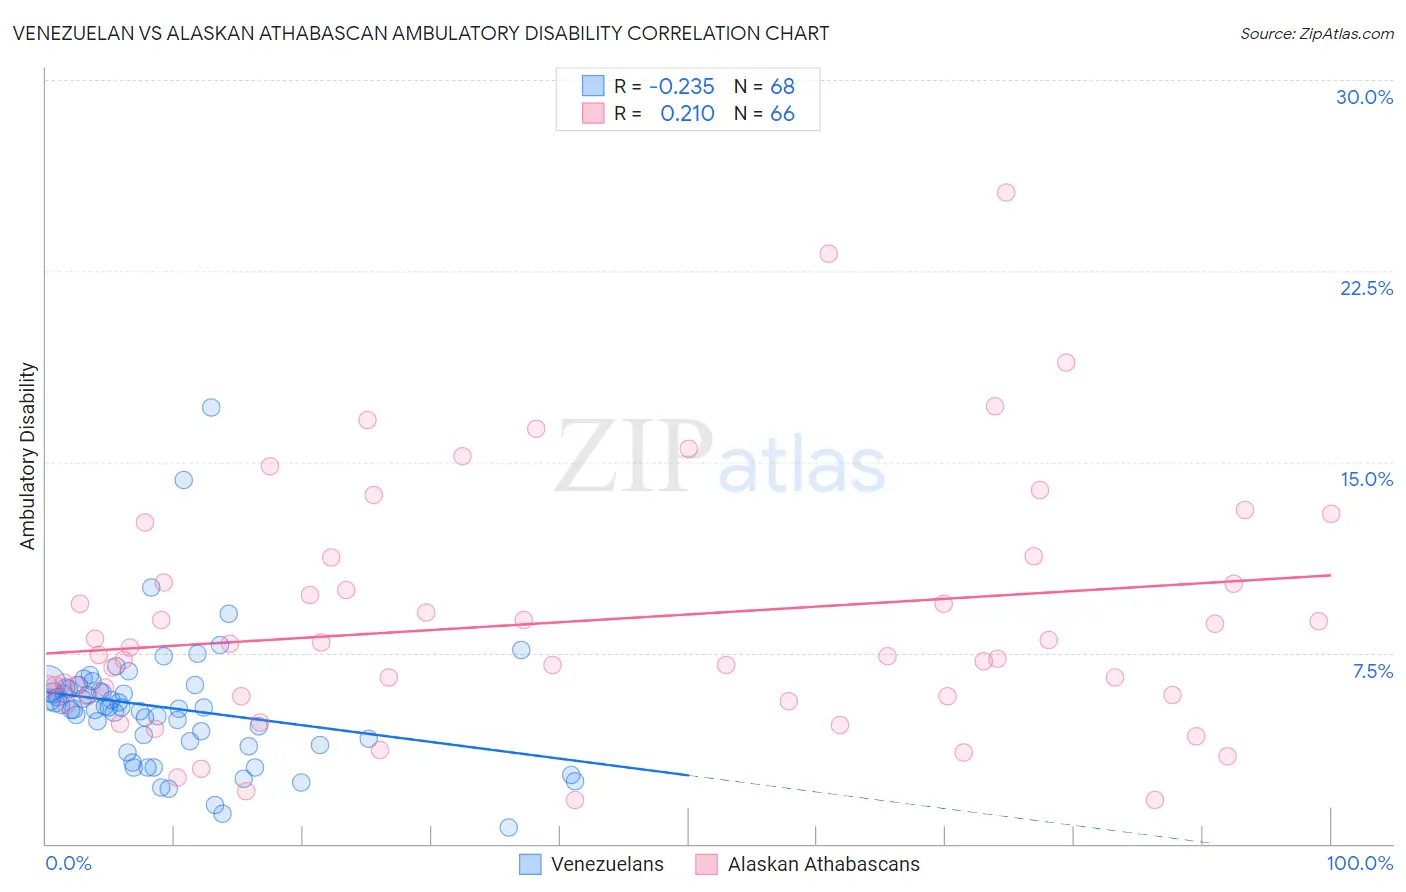
Venezuelan vs Alaskan Athabascan Ambulatory Disability Correlation Chart
The statistical analysis conducted on geographies consisting of 306,237,534 people shows a weak negative correlation between the proportion of Venezuelans and percentage of population with ambulatory disability in the United States with a correlation coefficient (R) of -0.235 and weighted average of 5.5%. Similarly, the statistical analysis conducted on geographies consisting of 45,819,153 people shows a weak positive correlation between the proportion of Alaskan Athabascans and percentage of population with ambulatory disability in the United States with a correlation coefficient (R) of 0.210 and weighted average of 6.9%, a difference of 25.8%.
Ambulatory Disability Correlation Summary
| Measurement | Venezuelan | Alaskan Athabascan |
| Minimum | 0.63% | 1.7% |
| Maximum | 17.1% | 25.6% |
| Range | 16.5% | 23.9% |
| Mean | 5.3% | 8.7% |
| Median | 5.4% | 7.4% |
| Interquartile 25% (IQ1) | 4.0% | 5.8% |
| Interquartile 75% (IQ3) | 6.1% | 10.3% |
| Interquartile Range (IQR) | 2.1% | 4.5% |
| Standard Deviation (Sample) | 2.6% | 4.9% |
| Standard Deviation (Population) | 2.5% | 4.8% |
Similar Demographics by Ambulatory Disability
Demographics Similar to Venezuelans by Ambulatory Disability
In terms of ambulatory disability, the demographic groups most similar to Venezuelans are Mongolian (5.5%, a difference of 0.080%), Argentinean (5.5%, a difference of 0.16%), Immigrants from Eritrea (5.5%, a difference of 0.34%), Turkish (5.5%, a difference of 0.43%), and Cypriot (5.5%, a difference of 0.43%).
| Demographics | Rating | Rank | Ambulatory Disability |
| Immigrants | Pakistan | 100.0 /100 | #33 | Exceptional 5.5% |
| Immigrants | Asia | 100.0 /100 | #34 | Exceptional 5.5% |
| Afghans | 100.0 /100 | #35 | Exceptional 5.5% |
| Immigrants | Malaysia | 100.0 /100 | #36 | Exceptional 5.5% |
| Turks | 100.0 /100 | #37 | Exceptional 5.5% |
| Cypriots | 100.0 /100 | #38 | Exceptional 5.5% |
| Immigrants | Eritrea | 100.0 /100 | #39 | Exceptional 5.5% |
| Venezuelans | 99.9 /100 | #40 | Exceptional 5.5% |
| Mongolians | 99.9 /100 | #41 | Exceptional 5.5% |
| Argentineans | 99.9 /100 | #42 | Exceptional 5.5% |
| Paraguayans | 99.9 /100 | #43 | Exceptional 5.5% |
| Immigrants | Indonesia | 99.9 /100 | #44 | Exceptional 5.5% |
| Immigrants | Sweden | 99.9 /100 | #45 | Exceptional 5.6% |
| Egyptians | 99.9 /100 | #46 | Exceptional 5.6% |
| Immigrants | Japan | 99.9 /100 | #47 | Exceptional 5.6% |
Demographics Similar to Alaskan Athabascans by Ambulatory Disability
In terms of ambulatory disability, the demographic groups most similar to Alaskan Athabascans are French American Indian (6.9%, a difference of 0.17%), Immigrants from Grenada (6.9%, a difference of 0.18%), Crow (6.9%, a difference of 0.23%), Cape Verdean (6.9%, a difference of 0.30%), and Puget Sound Salish (6.9%, a difference of 0.31%).
| Demographics | Rating | Rank | Ambulatory Disability |
| Immigrants | Dominica | 0.0 /100 | #289 | Tragic 6.9% |
| Scotch-Irish | 0.0 /100 | #290 | Tragic 6.9% |
| West Indians | 0.0 /100 | #291 | Tragic 6.9% |
| Cheyenne | 0.0 /100 | #292 | Tragic 6.9% |
| Immigrants | St. Vincent and the Grenadines | 0.0 /100 | #293 | Tragic 6.9% |
| Cape Verdeans | 0.0 /100 | #294 | Tragic 6.9% |
| Crow | 0.0 /100 | #295 | Tragic 6.9% |
| Alaskan Athabascans | 0.0 /100 | #296 | Tragic 6.9% |
| French American Indians | 0.0 /100 | #297 | Tragic 6.9% |
| Immigrants | Grenada | 0.0 /100 | #298 | Tragic 6.9% |
| Puget Sound Salish | 0.0 /100 | #299 | Tragic 6.9% |
| Marshallese | 0.0 /100 | #300 | Tragic 6.9% |
| British West Indians | 0.0 /100 | #301 | Tragic 7.0% |
| Immigrants | Armenia | 0.0 /100 | #302 | Tragic 7.0% |
| Africans | 0.0 /100 | #303 | Tragic 7.0% |