Somali vs Immigrants from Zaire Ambulatory Disability
COMPARE
Somali
Immigrants from Zaire
Ambulatory Disability
Ambulatory Disability Comparison
Somalis
Immigrants from Zaire
5.7%
AMBULATORY DISABILITY
99.2/ 100
METRIC RATING
78th/ 347
METRIC RANK
6.0%
AMBULATORY DISABILITY
83.6/ 100
METRIC RATING
139th/ 347
METRIC RANK
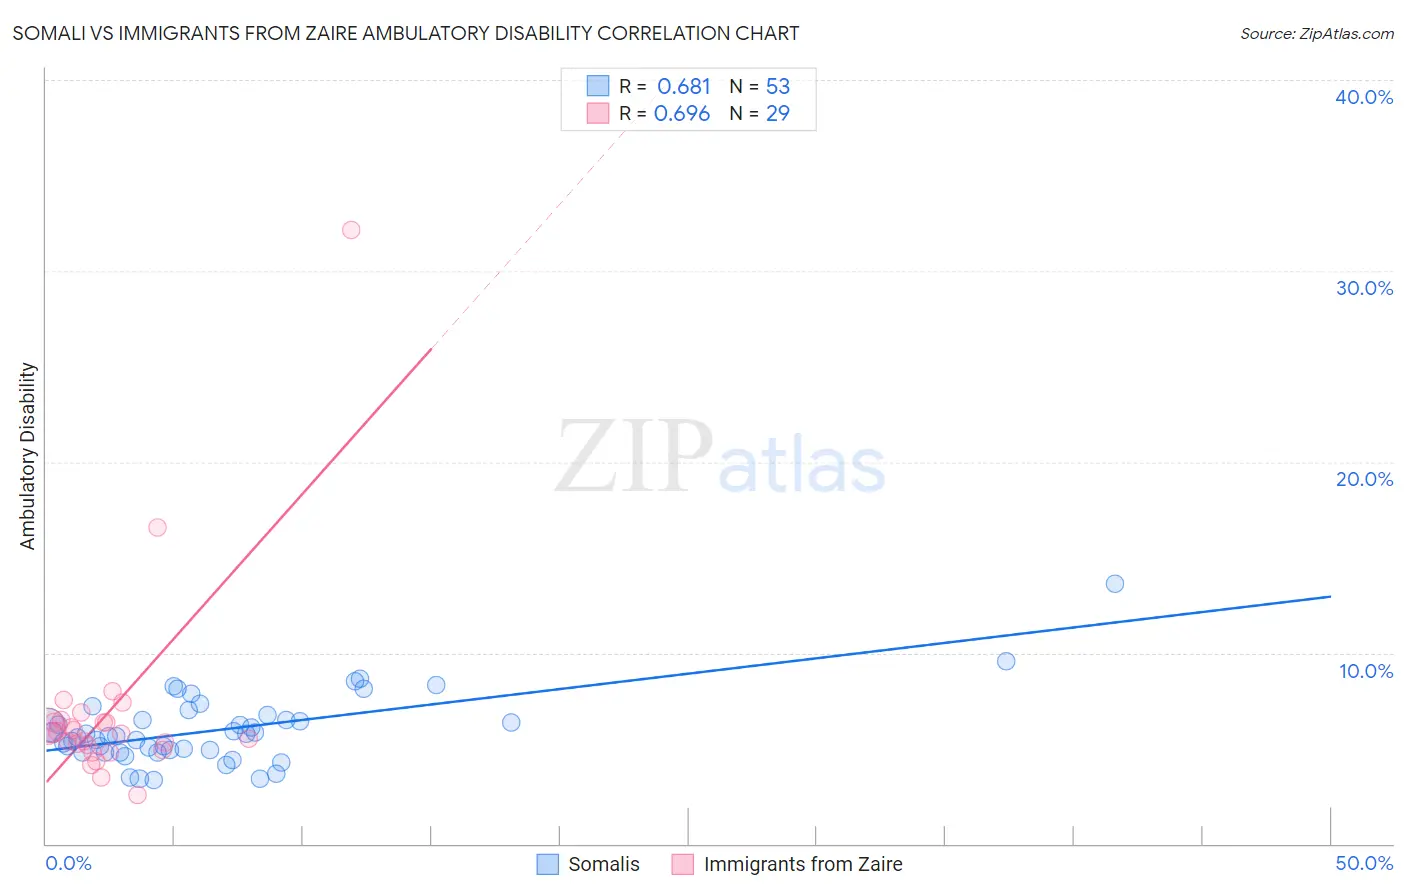
Somali vs Immigrants from Zaire Ambulatory Disability Correlation Chart
The statistical analysis conducted on geographies consisting of 99,294,852 people shows a significant positive correlation between the proportion of Somalis and percentage of population with ambulatory disability in the United States with a correlation coefficient (R) of 0.681 and weighted average of 5.7%. Similarly, the statistical analysis conducted on geographies consisting of 107,247,600 people shows a significant positive correlation between the proportion of Immigrants from Zaire and percentage of population with ambulatory disability in the United States with a correlation coefficient (R) of 0.696 and weighted average of 6.0%, a difference of 4.6%.
Ambulatory Disability Correlation Summary
| Measurement | Somali | Immigrants from Zaire |
| Minimum | 3.3% | 2.5% |
| Maximum | 13.6% | 32.2% |
| Range | 10.2% | 29.6% |
| Mean | 6.0% | 6.9% |
| Median | 5.7% | 5.8% |
| Interquartile 25% (IQ1) | 4.9% | 5.0% |
| Interquartile 75% (IQ3) | 6.6% | 6.4% |
| Interquartile Range (IQR) | 1.7% | 1.4% |
| Standard Deviation (Sample) | 1.8% | 5.4% |
| Standard Deviation (Population) | 1.8% | 5.3% |
Similar Demographics by Ambulatory Disability
Demographics Similar to Somalis by Ambulatory Disability
In terms of ambulatory disability, the demographic groups most similar to Somalis are Immigrants from Vietnam (5.7%, a difference of 0.010%), Chilean (5.7%, a difference of 0.010%), Immigrants from Ireland (5.7%, a difference of 0.14%), Immigrants from Jordan (5.7%, a difference of 0.14%), and Palestinian (5.7%, a difference of 0.15%).
| Demographics | Rating | Rank | Ambulatory Disability |
| Immigrants | Peru | 99.4 /100 | #71 | Exceptional 5.7% |
| Brazilians | 99.4 /100 | #72 | Exceptional 5.7% |
| Immigrants | Northern Africa | 99.4 /100 | #73 | Exceptional 5.7% |
| Immigrants | Cameroon | 99.4 /100 | #74 | Exceptional 5.7% |
| Immigrants | South Africa | 99.3 /100 | #75 | Exceptional 5.7% |
| Sudanese | 99.3 /100 | #76 | Exceptional 5.7% |
| Immigrants | Vietnam | 99.3 /100 | #77 | Exceptional 5.7% |
| Somalis | 99.2 /100 | #78 | Exceptional 5.7% |
| Chileans | 99.2 /100 | #79 | Exceptional 5.7% |
| Immigrants | Ireland | 99.2 /100 | #80 | Exceptional 5.7% |
| Immigrants | Jordan | 99.2 /100 | #81 | Exceptional 5.7% |
| Palestinians | 99.2 /100 | #82 | Exceptional 5.7% |
| Eastern Europeans | 99.2 /100 | #83 | Exceptional 5.7% |
| Ugandans | 99.2 /100 | #84 | Exceptional 5.7% |
| South Americans | 99.0 /100 | #85 | Exceptional 5.7% |
Demographics Similar to Immigrants from Zaire by Ambulatory Disability
In terms of ambulatory disability, the demographic groups most similar to Immigrants from Zaire are Immigrants from Hungary (6.0%, a difference of 0.030%), Czech (6.0%, a difference of 0.030%), Immigrants from North Macedonia (6.0%, a difference of 0.050%), Immigrants from Syria (6.0%, a difference of 0.050%), and Swedish (6.0%, a difference of 0.050%).
| Demographics | Rating | Rank | Ambulatory Disability |
| Immigrants | Europe | 87.8 /100 | #132 | Excellent 6.0% |
| Immigrants | Immigrants | 86.9 /100 | #133 | Excellent 6.0% |
| Ute | 86.6 /100 | #134 | Excellent 6.0% |
| Immigrants | Italy | 85.0 /100 | #135 | Excellent 6.0% |
| Immigrants | North Macedonia | 84.1 /100 | #136 | Excellent 6.0% |
| Immigrants | Syria | 84.1 /100 | #137 | Excellent 6.0% |
| Immigrants | Hungary | 83.9 /100 | #138 | Excellent 6.0% |
| Immigrants | Zaire | 83.6 /100 | #139 | Excellent 6.0% |
| Czechs | 83.3 /100 | #140 | Excellent 6.0% |
| Swedes | 83.1 /100 | #141 | Excellent 6.0% |
| Immigrants | Philippines | 83.0 /100 | #142 | Excellent 6.0% |
| Romanians | 82.9 /100 | #143 | Excellent 6.0% |
| Macedonians | 82.8 /100 | #144 | Excellent 6.0% |
| Pakistanis | 82.5 /100 | #145 | Excellent 6.0% |
| Immigrants | Greece | 82.5 /100 | #146 | Excellent 6.0% |