Czechoslovakian vs Immigrants from Dominican Republic Ambulatory Disability
COMPARE
Czechoslovakian
Immigrants from Dominican Republic
Ambulatory Disability
Ambulatory Disability Comparison
Czechoslovakians
Immigrants from Dominican Republic
6.4%
AMBULATORY DISABILITY
3.8/ 100
METRIC RATING
229th/ 347
METRIC RANK
7.1%
AMBULATORY DISABILITY
0.0/ 100
METRIC RATING
316th/ 347
METRIC RANK
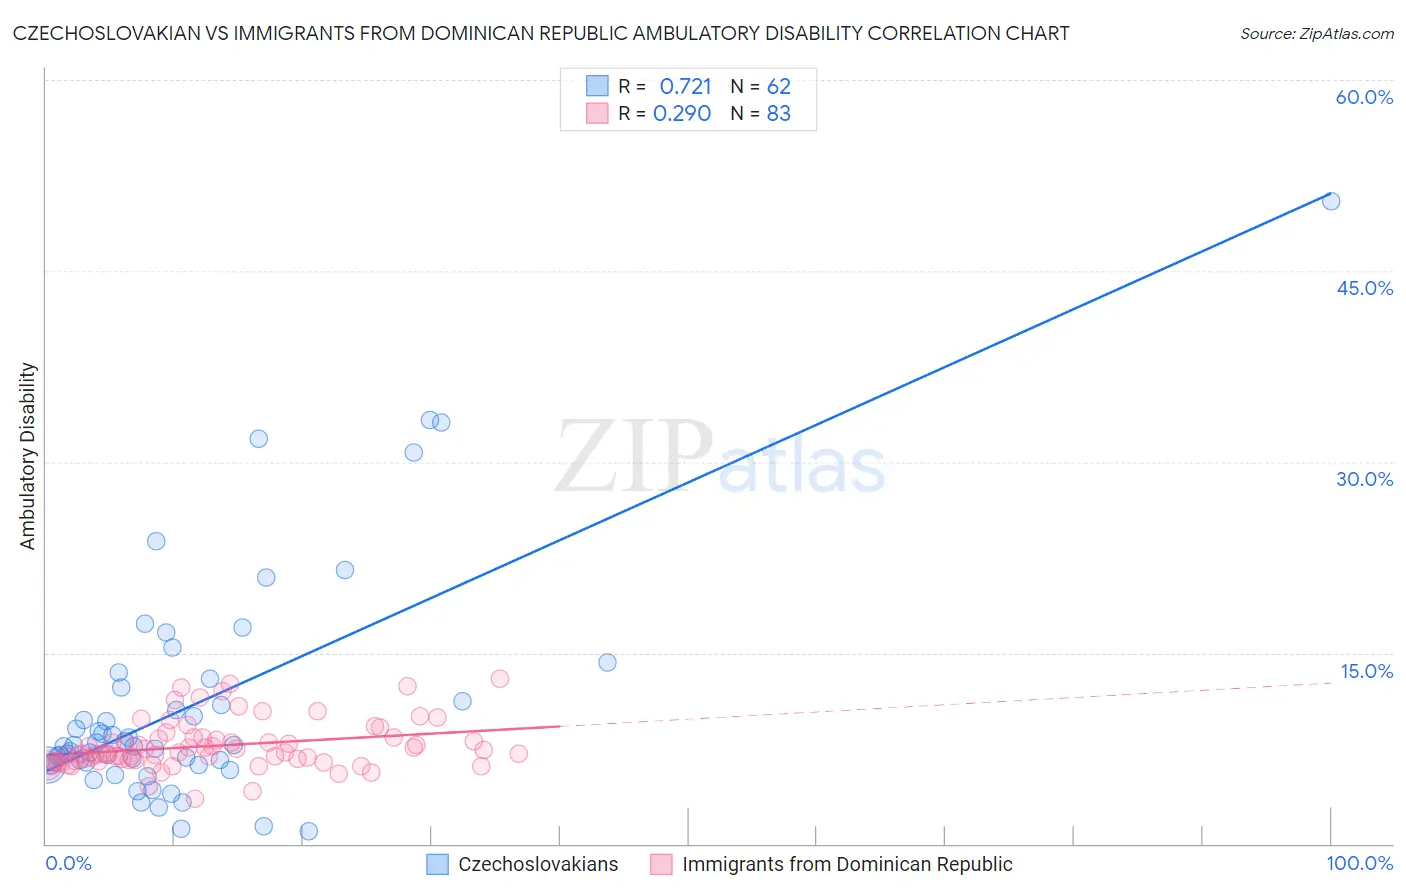
Czechoslovakian vs Immigrants from Dominican Republic Ambulatory Disability Correlation Chart
The statistical analysis conducted on geographies consisting of 368,636,980 people shows a strong positive correlation between the proportion of Czechoslovakians and percentage of population with ambulatory disability in the United States with a correlation coefficient (R) of 0.721 and weighted average of 6.4%. Similarly, the statistical analysis conducted on geographies consisting of 275,045,081 people shows a weak positive correlation between the proportion of Immigrants from Dominican Republic and percentage of population with ambulatory disability in the United States with a correlation coefficient (R) of 0.290 and weighted average of 7.1%, a difference of 12.1%.
Ambulatory Disability Correlation Summary
| Measurement | Czechoslovakian | Immigrants from Dominican Republic |
| Minimum | 0.94% | 3.5% |
| Maximum | 50.5% | 13.0% |
| Range | 49.6% | 9.5% |
| Mean | 10.8% | 7.7% |
| Median | 7.7% | 7.1% |
| Interquartile 25% (IQ1) | 6.3% | 6.5% |
| Interquartile 75% (IQ3) | 12.3% | 8.3% |
| Interquartile Range (IQR) | 6.0% | 1.8% |
| Standard Deviation (Sample) | 9.1% | 1.9% |
| Standard Deviation (Population) | 9.0% | 1.9% |
Similar Demographics by Ambulatory Disability
Demographics Similar to Czechoslovakians by Ambulatory Disability
In terms of ambulatory disability, the demographic groups most similar to Czechoslovakians are Portuguese (6.4%, a difference of 0.050%), Cuban (6.4%, a difference of 0.060%), Mexican (6.4%, a difference of 0.11%), Panamanian (6.4%, a difference of 0.26%), and Slavic (6.4%, a difference of 0.39%).
| Demographics | Rating | Rank | Ambulatory Disability |
| German Russians | 9.4 /100 | #222 | Tragic 6.3% |
| Immigrants | Honduras | 7.6 /100 | #223 | Tragic 6.3% |
| Liberians | 7.1 /100 | #224 | Tragic 6.3% |
| Hondurans | 6.3 /100 | #225 | Tragic 6.3% |
| Slavs | 5.1 /100 | #226 | Tragic 6.4% |
| Cubans | 4.0 /100 | #227 | Tragic 6.4% |
| Portuguese | 4.0 /100 | #228 | Tragic 6.4% |
| Czechoslovakians | 3.8 /100 | #229 | Tragic 6.4% |
| Mexicans | 3.5 /100 | #230 | Tragic 6.4% |
| Panamanians | 3.1 /100 | #231 | Tragic 6.4% |
| Assyrians/Chaldeans/Syriacs | 2.4 /100 | #232 | Tragic 6.4% |
| Sub-Saharan Africans | 2.3 /100 | #233 | Tragic 6.4% |
| Immigrants | Liberia | 2.3 /100 | #234 | Tragic 6.4% |
| Hispanics or Latinos | 2.2 /100 | #235 | Tragic 6.4% |
| Dutch | 2.0 /100 | #236 | Tragic 6.4% |
Demographics Similar to Immigrants from Dominican Republic by Ambulatory Disability
In terms of ambulatory disability, the demographic groups most similar to Immigrants from Dominican Republic are Central American Indian (7.2%, a difference of 0.080%), Ottawa (7.2%, a difference of 0.17%), Shoshone (7.1%, a difference of 0.24%), Blackfeet (7.1%, a difference of 0.26%), and Immigrants from Yemen (7.1%, a difference of 0.28%).
| Demographics | Rating | Rank | Ambulatory Disability |
| Immigrants | Azores | 0.0 /100 | #309 | Tragic 7.1% |
| Arapaho | 0.0 /100 | #310 | Tragic 7.1% |
| Cree | 0.0 /100 | #311 | Tragic 7.1% |
| Delaware | 0.0 /100 | #312 | Tragic 7.1% |
| Immigrants | Yemen | 0.0 /100 | #313 | Tragic 7.1% |
| Blackfeet | 0.0 /100 | #314 | Tragic 7.1% |
| Shoshone | 0.0 /100 | #315 | Tragic 7.1% |
| Immigrants | Dominican Republic | 0.0 /100 | #316 | Tragic 7.1% |
| Central American Indians | 0.0 /100 | #317 | Tragic 7.2% |
| Ottawa | 0.0 /100 | #318 | Tragic 7.2% |
| Dominicans | 0.0 /100 | #319 | Tragic 7.2% |
| Potawatomi | 0.0 /100 | #320 | Tragic 7.3% |
| Apache | 0.0 /100 | #321 | Tragic 7.4% |
| Osage | 0.0 /100 | #322 | Tragic 7.4% |
| Americans | 0.0 /100 | #323 | Tragic 7.4% |