Cypriot vs Immigrants from Netherlands Cognitive Disability
COMPARE
Cypriot
Immigrants from Netherlands
Cognitive Disability
Cognitive Disability Comparison
Cypriots
Immigrants from Netherlands
17.1%
COGNITIVE DISABILITY
85.7/ 100
METRIC RATING
149th/ 347
METRIC RANK
16.7%
COGNITIVE DISABILITY
99.2/ 100
METRIC RATING
81st/ 347
METRIC RANK
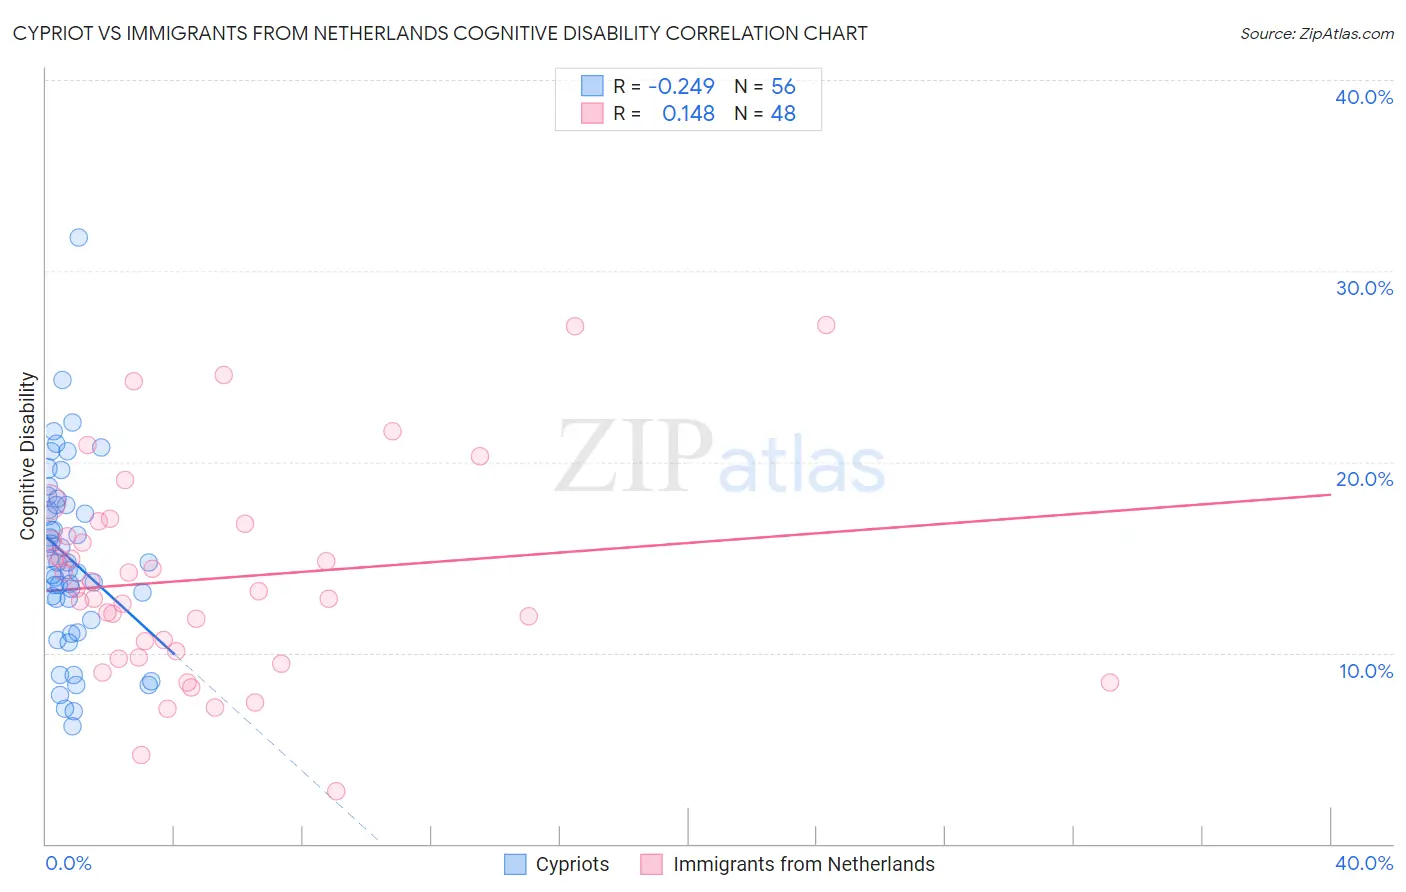
Cypriot vs Immigrants from Netherlands Cognitive Disability Correlation Chart
The statistical analysis conducted on geographies consisting of 61,869,277 people shows a weak negative correlation between the proportion of Cypriots and percentage of population with cognitive disability in the United States with a correlation coefficient (R) of -0.249 and weighted average of 17.1%. Similarly, the statistical analysis conducted on geographies consisting of 237,879,934 people shows a poor positive correlation between the proportion of Immigrants from Netherlands and percentage of population with cognitive disability in the United States with a correlation coefficient (R) of 0.148 and weighted average of 16.7%, a difference of 2.3%.
Cognitive Disability Correlation Summary
| Measurement | Cypriot | Immigrants from Netherlands |
| Minimum | 6.1% | 2.7% |
| Maximum | 31.8% | 27.2% |
| Range | 25.6% | 24.4% |
| Mean | 14.9% | 13.9% |
| Median | 14.7% | 13.3% |
| Interquartile 25% (IQ1) | 12.3% | 9.9% |
| Interquartile 75% (IQ3) | 17.7% | 16.5% |
| Interquartile Range (IQR) | 5.5% | 6.6% |
| Standard Deviation (Sample) | 4.8% | 5.4% |
| Standard Deviation (Population) | 4.8% | 5.4% |
Similar Demographics by Cognitive Disability
Demographics Similar to Cypriots by Cognitive Disability
In terms of cognitive disability, the demographic groups most similar to Cypriots are French Canadian (17.1%, a difference of 0.0%), Scotch-Irish (17.1%, a difference of 0.010%), Basque (17.1%, a difference of 0.010%), Costa Rican (17.0%, a difference of 0.14%), and Syrian (17.1%, a difference of 0.15%).
| Demographics | Rating | Rank | Cognitive Disability |
| Carpatho Rusyns | 89.6 /100 | #142 | Excellent 17.0% |
| British | 89.3 /100 | #143 | Excellent 17.0% |
| Immigrants | Brazil | 89.3 /100 | #144 | Excellent 17.0% |
| Immigrants | South Eastern Asia | 88.7 /100 | #145 | Excellent 17.0% |
| Costa Ricans | 88.0 /100 | #146 | Excellent 17.0% |
| Scotch-Irish | 85.9 /100 | #147 | Excellent 17.1% |
| French Canadians | 85.7 /100 | #148 | Excellent 17.1% |
| Cypriots | 85.7 /100 | #149 | Excellent 17.1% |
| Basques | 85.5 /100 | #150 | Excellent 17.1% |
| Syrians | 83.0 /100 | #151 | Excellent 17.1% |
| Immigrants | Indonesia | 82.7 /100 | #152 | Excellent 17.1% |
| Immigrants | Kazakhstan | 80.5 /100 | #153 | Excellent 17.1% |
| Immigrants | Malaysia | 79.3 /100 | #154 | Good 17.1% |
| Brazilians | 78.9 /100 | #155 | Good 17.1% |
| Sri Lankans | 78.9 /100 | #156 | Good 17.1% |
Demographics Similar to Immigrants from Netherlands by Cognitive Disability
In terms of cognitive disability, the demographic groups most similar to Immigrants from Netherlands are Egyptian (16.7%, a difference of 0.010%), Swiss (16.7%, a difference of 0.030%), Peruvian (16.7%, a difference of 0.040%), Immigrants from Bulgaria (16.7%, a difference of 0.040%), and Immigrants from Hungary (16.7%, a difference of 0.050%).
| Demographics | Rating | Rank | Cognitive Disability |
| Slavs | 99.3 /100 | #74 | Exceptional 16.7% |
| Estonians | 99.3 /100 | #75 | Exceptional 16.7% |
| Immigrants | Serbia | 99.3 /100 | #76 | Exceptional 16.7% |
| Immigrants | Hungary | 99.3 /100 | #77 | Exceptional 16.7% |
| Peruvians | 99.3 /100 | #78 | Exceptional 16.7% |
| Immigrants | Bulgaria | 99.3 /100 | #79 | Exceptional 16.7% |
| Egyptians | 99.2 /100 | #80 | Exceptional 16.7% |
| Immigrants | Netherlands | 99.2 /100 | #81 | Exceptional 16.7% |
| Swiss | 99.2 /100 | #82 | Exceptional 16.7% |
| Serbians | 99.1 /100 | #83 | Exceptional 16.7% |
| Belgians | 99.1 /100 | #84 | Exceptional 16.7% |
| Immigrants | Moldova | 99.1 /100 | #85 | Exceptional 16.7% |
| Immigrants | South Africa | 99.0 /100 | #86 | Exceptional 16.7% |
| Native Hawaiians | 99.0 /100 | #87 | Exceptional 16.7% |
| Immigrants | Philippines | 99.0 /100 | #88 | Exceptional 16.7% |