Cambodian vs Immigrants Cognitive Disability
COMPARE
Cambodian
Immigrants
Cognitive Disability
Cognitive Disability Comparison
Cambodians
Immigrants
17.3%
COGNITIVE DISABILITY
35.9/ 100
METRIC RATING
186th/ 347
METRIC RANK
17.2%
COGNITIVE DISABILITY
62.5/ 100
METRIC RATING
168th/ 347
METRIC RANK
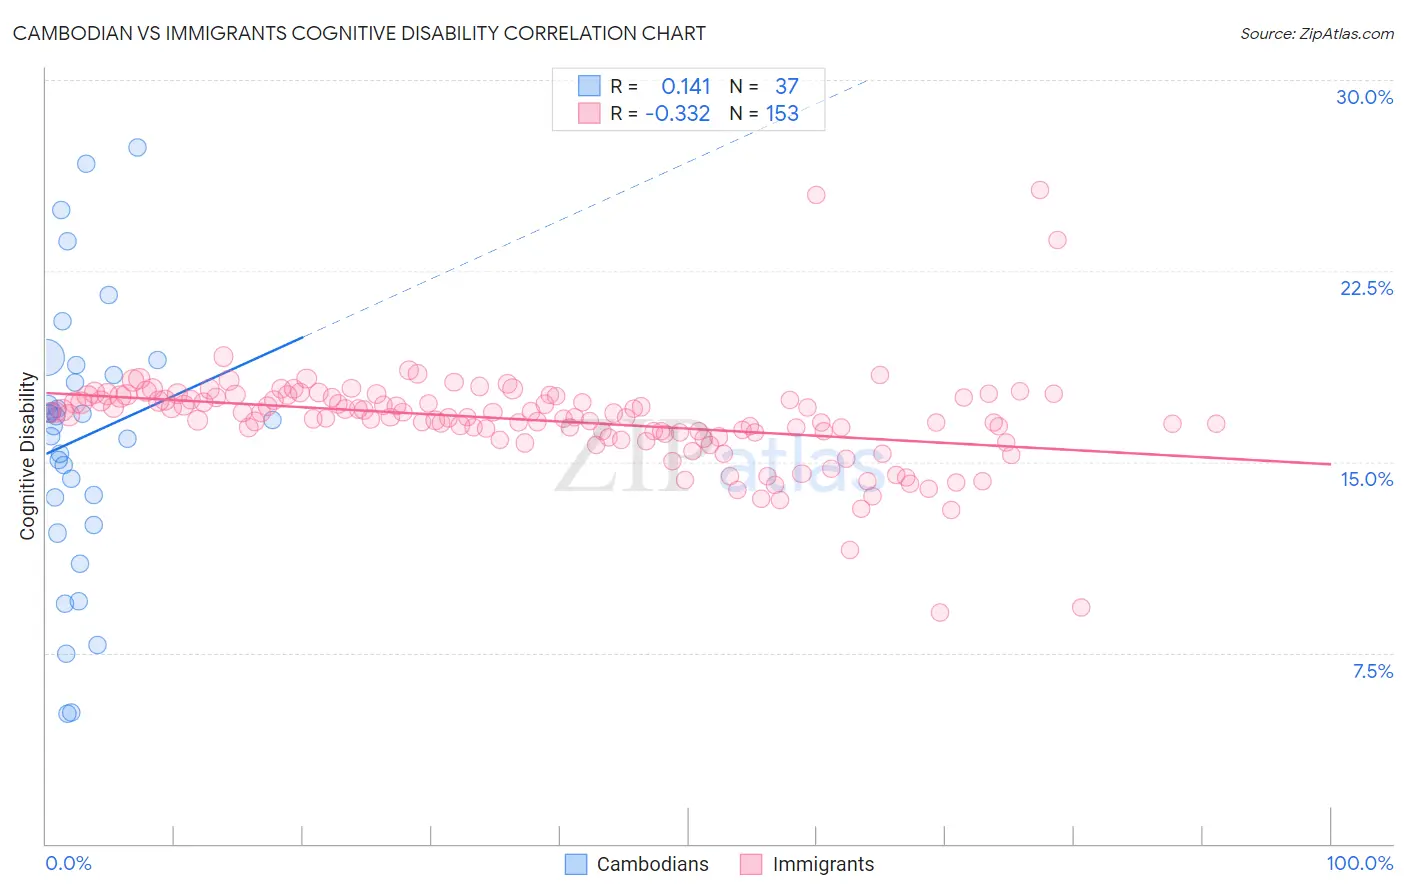
Cambodian vs Immigrants Cognitive Disability Correlation Chart
The statistical analysis conducted on geographies consisting of 102,506,986 people shows a poor positive correlation between the proportion of Cambodians and percentage of population with cognitive disability in the United States with a correlation coefficient (R) of 0.141 and weighted average of 17.3%. Similarly, the statistical analysis conducted on geographies consisting of 577,580,100 people shows a mild negative correlation between the proportion of Immigrants and percentage of population with cognitive disability in the United States with a correlation coefficient (R) of -0.332 and weighted average of 17.2%, a difference of 0.78%.
Cognitive Disability Correlation Summary
| Measurement | Cambodian | Immigrants |
| Minimum | 5.1% | 9.1% |
| Maximum | 27.4% | 25.7% |
| Range | 22.2% | 16.6% |
| Mean | 15.9% | 16.6% |
| Median | 16.7% | 16.8% |
| Interquartile 25% (IQ1) | 13.1% | 16.0% |
| Interquartile 75% (IQ3) | 18.6% | 17.6% |
| Interquartile Range (IQR) | 5.5% | 1.5% |
| Standard Deviation (Sample) | 5.3% | 1.9% |
| Standard Deviation (Population) | 5.2% | 1.9% |
Demographics Similar to Cambodians and Immigrants by Cognitive Disability
In terms of cognitive disability, the demographic groups most similar to Cambodians are Afghan (17.3%, a difference of 0.070%), Immigrants from Fiji (17.4%, a difference of 0.070%), Crow (17.3%, a difference of 0.10%), Spaniard (17.3%, a difference of 0.13%), and Immigrants from Guyana (17.3%, a difference of 0.21%). Similarly, the demographic groups most similar to Immigrants are Immigrants from Portugal (17.2%, a difference of 0.020%), Immigrants from Syria (17.2%, a difference of 0.030%), Ecuadorian (17.2%, a difference of 0.090%), Tlingit-Haida (17.2%, a difference of 0.090%), and Immigrants from Turkey (17.2%, a difference of 0.17%).
| Demographics | Rating | Rank | Cognitive Disability |
| Immigrants | Syria | 63.5 /100 | #167 | Good 17.2% |
| Immigrants | Immigrants | 62.5 /100 | #168 | Good 17.2% |
| Immigrants | Portugal | 61.8 /100 | #169 | Good 17.2% |
| Ecuadorians | 59.6 /100 | #170 | Average 17.2% |
| Tlingit-Haida | 59.4 /100 | #171 | Average 17.2% |
| Immigrants | Turkey | 56.7 /100 | #172 | Average 17.2% |
| Immigrants | Northern Africa | 50.2 /100 | #173 | Average 17.3% |
| Laotians | 50.0 /100 | #174 | Average 17.3% |
| Tsimshian | 49.8 /100 | #175 | Average 17.3% |
| Shoshone | 49.2 /100 | #176 | Average 17.3% |
| Ute | 49.1 /100 | #177 | Average 17.3% |
| Spanish | 48.9 /100 | #178 | Average 17.3% |
| Sioux | 48.6 /100 | #179 | Average 17.3% |
| Pakistanis | 43.9 /100 | #180 | Average 17.3% |
| Immigrants | Guyana | 42.9 /100 | #181 | Average 17.3% |
| Arabs | 42.8 /100 | #182 | Average 17.3% |
| Spaniards | 40.3 /100 | #183 | Average 17.3% |
| Crow | 39.1 /100 | #184 | Fair 17.3% |
| Afghans | 38.2 /100 | #185 | Fair 17.3% |
| Cambodians | 35.9 /100 | #186 | Fair 17.3% |
| Immigrants | Fiji | 33.7 /100 | #187 | Fair 17.4% |