Colombian vs Immigrants Cognitive Disability
COMPARE
Colombian
Immigrants
Cognitive Disability
Cognitive Disability Comparison
Colombians
Immigrants
16.6%
COGNITIVE DISABILITY
99.6/ 100
METRIC RATING
65th/ 347
METRIC RANK
17.2%
COGNITIVE DISABILITY
62.5/ 100
METRIC RATING
168th/ 347
METRIC RANK
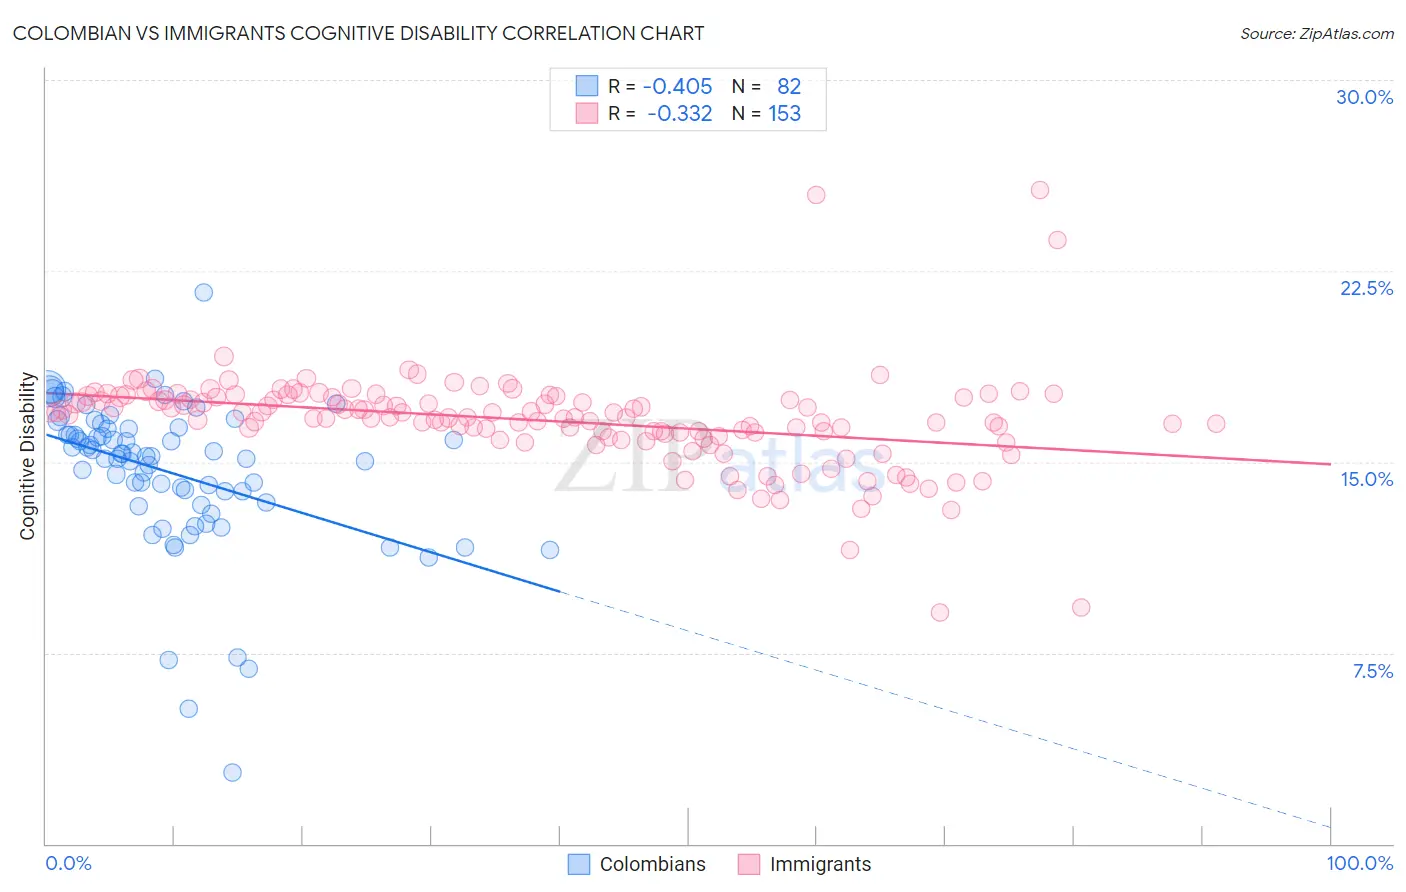
Colombian vs Immigrants Cognitive Disability Correlation Chart
The statistical analysis conducted on geographies consisting of 419,606,115 people shows a moderate negative correlation between the proportion of Colombians and percentage of population with cognitive disability in the United States with a correlation coefficient (R) of -0.405 and weighted average of 16.6%. Similarly, the statistical analysis conducted on geographies consisting of 577,580,100 people shows a mild negative correlation between the proportion of Immigrants and percentage of population with cognitive disability in the United States with a correlation coefficient (R) of -0.332 and weighted average of 17.2%, a difference of 3.6%.
Cognitive Disability Correlation Summary
| Measurement | Colombian | Immigrants |
| Minimum | 2.8% | 9.1% |
| Maximum | 21.7% | 25.7% |
| Range | 18.9% | 16.6% |
| Mean | 14.6% | 16.6% |
| Median | 15.3% | 16.8% |
| Interquartile 25% (IQ1) | 13.4% | 16.0% |
| Interquartile 75% (IQ3) | 16.3% | 17.6% |
| Interquartile Range (IQR) | 2.9% | 1.5% |
| Standard Deviation (Sample) | 3.0% | 1.9% |
| Standard Deviation (Population) | 2.9% | 1.9% |
Similar Demographics by Cognitive Disability
Demographics Similar to Colombians by Cognitive Disability
In terms of cognitive disability, the demographic groups most similar to Colombians are Venezuelan (16.6%, a difference of 0.010%), Argentinean (16.6%, a difference of 0.070%), Czechoslovakian (16.6%, a difference of 0.10%), Immigrants from Ukraine (16.6%, a difference of 0.12%), and Immigrants from England (16.6%, a difference of 0.13%).
| Demographics | Rating | Rank | Cognitive Disability |
| Pennsylvania Germans | 99.7 /100 | #58 | Exceptional 16.6% |
| Immigrants | Peru | 99.7 /100 | #59 | Exceptional 16.6% |
| Romanians | 99.7 /100 | #60 | Exceptional 16.6% |
| Immigrants | England | 99.6 /100 | #61 | Exceptional 16.6% |
| Czechoslovakians | 99.6 /100 | #62 | Exceptional 16.6% |
| Argentineans | 99.6 /100 | #63 | Exceptional 16.6% |
| Venezuelans | 99.6 /100 | #64 | Exceptional 16.6% |
| Colombians | 99.6 /100 | #65 | Exceptional 16.6% |
| Immigrants | Ukraine | 99.5 /100 | #66 | Exceptional 16.6% |
| Latvians | 99.5 /100 | #67 | Exceptional 16.6% |
| Ukrainians | 99.4 /100 | #68 | Exceptional 16.6% |
| Immigrants | Uzbekistan | 99.4 /100 | #69 | Exceptional 16.7% |
| Immigrants | Sweden | 99.4 /100 | #70 | Exceptional 16.7% |
| Immigrants | Belgium | 99.3 /100 | #71 | Exceptional 16.7% |
| Germans | 99.3 /100 | #72 | Exceptional 16.7% |
Demographics Similar to Immigrants by Cognitive Disability
In terms of cognitive disability, the demographic groups most similar to Immigrants are Immigrants from Portugal (17.2%, a difference of 0.020%), Immigrants from Syria (17.2%, a difference of 0.030%), Immigrants from Ecuador (17.2%, a difference of 0.060%), Immigrants from Albania (17.2%, a difference of 0.070%), and Ecuadorian (17.2%, a difference of 0.090%).
| Demographics | Rating | Rank | Cognitive Disability |
| Americans | 72.2 /100 | #161 | Good 17.2% |
| Yugoslavians | 71.6 /100 | #162 | Good 17.2% |
| Immigrants | Switzerland | 71.5 /100 | #163 | Good 17.2% |
| Armenians | 70.1 /100 | #164 | Good 17.2% |
| Immigrants | Albania | 64.9 /100 | #165 | Good 17.2% |
| Immigrants | Ecuador | 64.4 /100 | #166 | Good 17.2% |
| Immigrants | Syria | 63.5 /100 | #167 | Good 17.2% |
| Immigrants | Immigrants | 62.5 /100 | #168 | Good 17.2% |
| Immigrants | Portugal | 61.8 /100 | #169 | Good 17.2% |
| Ecuadorians | 59.6 /100 | #170 | Average 17.2% |
| Tlingit-Haida | 59.4 /100 | #171 | Average 17.2% |
| Immigrants | Turkey | 56.7 /100 | #172 | Average 17.2% |
| Immigrants | Northern Africa | 50.2 /100 | #173 | Average 17.3% |
| Laotians | 50.0 /100 | #174 | Average 17.3% |
| Tsimshian | 49.8 /100 | #175 | Average 17.3% |