Jordanian vs Immigrants Cognitive Disability
COMPARE
Jordanian
Immigrants
Cognitive Disability
Cognitive Disability Comparison
Jordanians
Immigrants
16.8%
COGNITIVE DISABILITY
98.2/ 100
METRIC RATING
99th/ 347
METRIC RANK
17.2%
COGNITIVE DISABILITY
62.5/ 100
METRIC RATING
168th/ 347
METRIC RANK
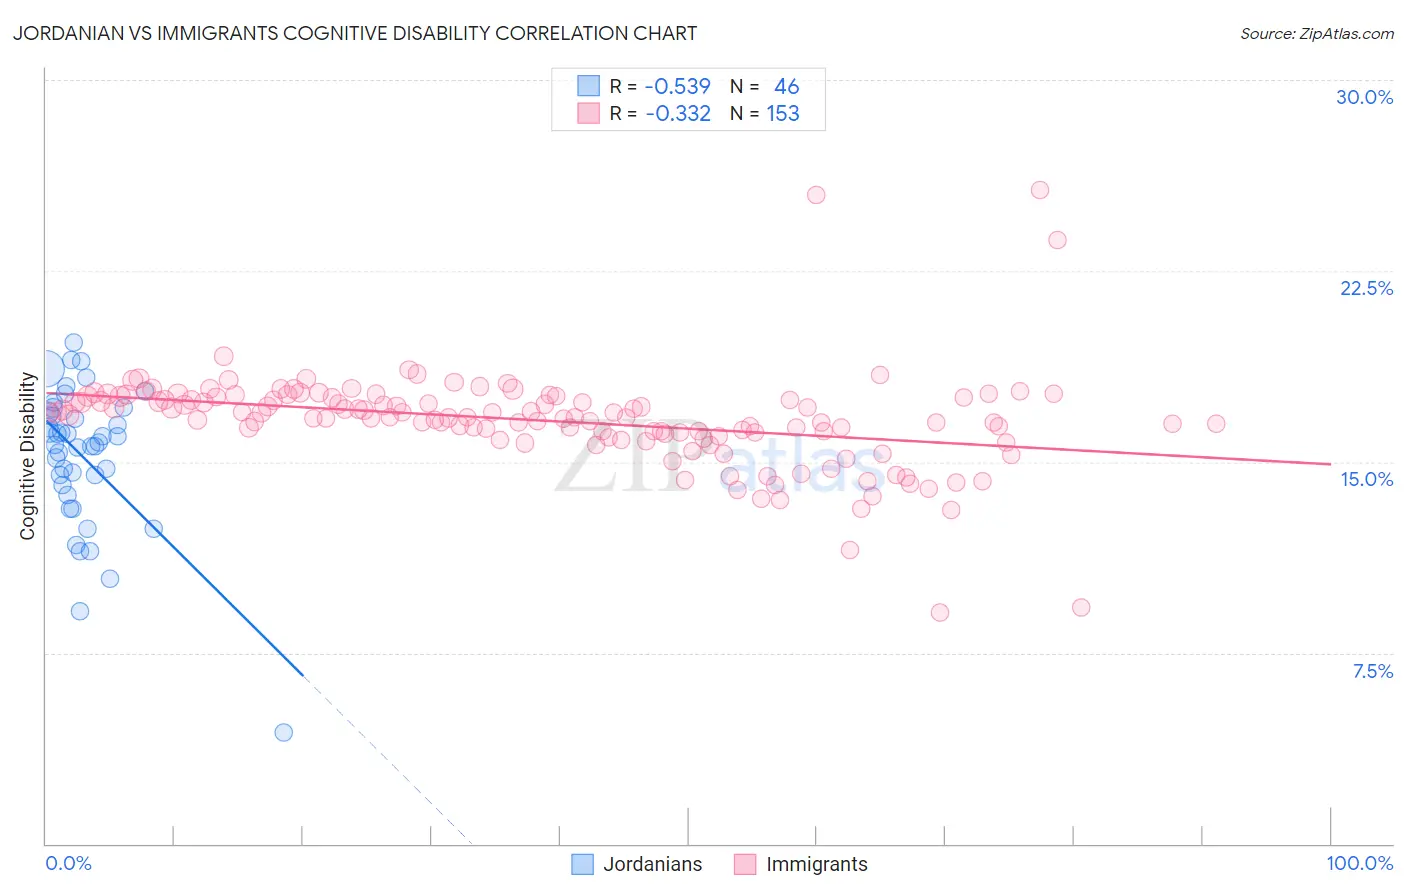
Jordanian vs Immigrants Cognitive Disability Correlation Chart
The statistical analysis conducted on geographies consisting of 166,416,373 people shows a substantial negative correlation between the proportion of Jordanians and percentage of population with cognitive disability in the United States with a correlation coefficient (R) of -0.539 and weighted average of 16.8%. Similarly, the statistical analysis conducted on geographies consisting of 577,580,100 people shows a mild negative correlation between the proportion of Immigrants and percentage of population with cognitive disability in the United States with a correlation coefficient (R) of -0.332 and weighted average of 17.2%, a difference of 2.6%.
Cognitive Disability Correlation Summary
| Measurement | Jordanian | Immigrants |
| Minimum | 4.3% | 9.1% |
| Maximum | 19.7% | 25.7% |
| Range | 15.3% | 16.6% |
| Mean | 15.2% | 16.6% |
| Median | 15.7% | 16.8% |
| Interquartile 25% (IQ1) | 14.1% | 16.0% |
| Interquartile 75% (IQ3) | 16.9% | 17.6% |
| Interquartile Range (IQR) | 2.8% | 1.5% |
| Standard Deviation (Sample) | 2.9% | 1.9% |
| Standard Deviation (Population) | 2.8% | 1.9% |
Similar Demographics by Cognitive Disability
Demographics Similar to Jordanians by Cognitive Disability
In terms of cognitive disability, the demographic groups most similar to Jordanians are Immigrants from Russia (16.8%, a difference of 0.030%), Immigrants from Asia (16.8%, a difference of 0.040%), Irish (16.8%, a difference of 0.060%), Immigrants from Lebanon (16.8%, a difference of 0.090%), and Dutch (16.8%, a difference of 0.11%).
| Demographics | Rating | Rank | Cognitive Disability |
| Immigrants | South America | 98.8 /100 | #92 | Exceptional 16.7% |
| Immigrants | Southern Europe | 98.7 /100 | #93 | Exceptional 16.7% |
| Asians | 98.7 /100 | #94 | Exceptional 16.7% |
| English | 98.6 /100 | #95 | Exceptional 16.8% |
| Finns | 98.5 /100 | #96 | Exceptional 16.8% |
| Dutch | 98.5 /100 | #97 | Exceptional 16.8% |
| Immigrants | Lebanon | 98.4 /100 | #98 | Exceptional 16.8% |
| Jordanians | 98.2 /100 | #99 | Exceptional 16.8% |
| Immigrants | Russia | 98.2 /100 | #100 | Exceptional 16.8% |
| Immigrants | Asia | 98.1 /100 | #101 | Exceptional 16.8% |
| Irish | 98.1 /100 | #102 | Exceptional 16.8% |
| Paraguayans | 98.0 /100 | #103 | Exceptional 16.8% |
| Palestinians | 98.0 /100 | #104 | Exceptional 16.8% |
| Immigrants | Eastern Asia | 97.9 /100 | #105 | Exceptional 16.8% |
| Northern Europeans | 97.8 /100 | #106 | Exceptional 16.8% |
Demographics Similar to Immigrants by Cognitive Disability
In terms of cognitive disability, the demographic groups most similar to Immigrants are Immigrants from Portugal (17.2%, a difference of 0.020%), Immigrants from Syria (17.2%, a difference of 0.030%), Immigrants from Ecuador (17.2%, a difference of 0.060%), Immigrants from Albania (17.2%, a difference of 0.070%), and Ecuadorian (17.2%, a difference of 0.090%).
| Demographics | Rating | Rank | Cognitive Disability |
| Americans | 72.2 /100 | #161 | Good 17.2% |
| Yugoslavians | 71.6 /100 | #162 | Good 17.2% |
| Immigrants | Switzerland | 71.5 /100 | #163 | Good 17.2% |
| Armenians | 70.1 /100 | #164 | Good 17.2% |
| Immigrants | Albania | 64.9 /100 | #165 | Good 17.2% |
| Immigrants | Ecuador | 64.4 /100 | #166 | Good 17.2% |
| Immigrants | Syria | 63.5 /100 | #167 | Good 17.2% |
| Immigrants | Immigrants | 62.5 /100 | #168 | Good 17.2% |
| Immigrants | Portugal | 61.8 /100 | #169 | Good 17.2% |
| Ecuadorians | 59.6 /100 | #170 | Average 17.2% |
| Tlingit-Haida | 59.4 /100 | #171 | Average 17.2% |
| Immigrants | Turkey | 56.7 /100 | #172 | Average 17.2% |
| Immigrants | Northern Africa | 50.2 /100 | #173 | Average 17.3% |
| Laotians | 50.0 /100 | #174 | Average 17.3% |
| Tsimshian | 49.8 /100 | #175 | Average 17.3% |