Cypriot vs Immigrants from Croatia Cognitive Disability
COMPARE
Cypriot
Immigrants from Croatia
Cognitive Disability
Cognitive Disability Comparison
Cypriots
Immigrants from Croatia
17.1%
COGNITIVE DISABILITY
85.7/ 100
METRIC RATING
149th/ 347
METRIC RANK
16.4%
COGNITIVE DISABILITY
99.9/ 100
METRIC RATING
26th/ 347
METRIC RANK
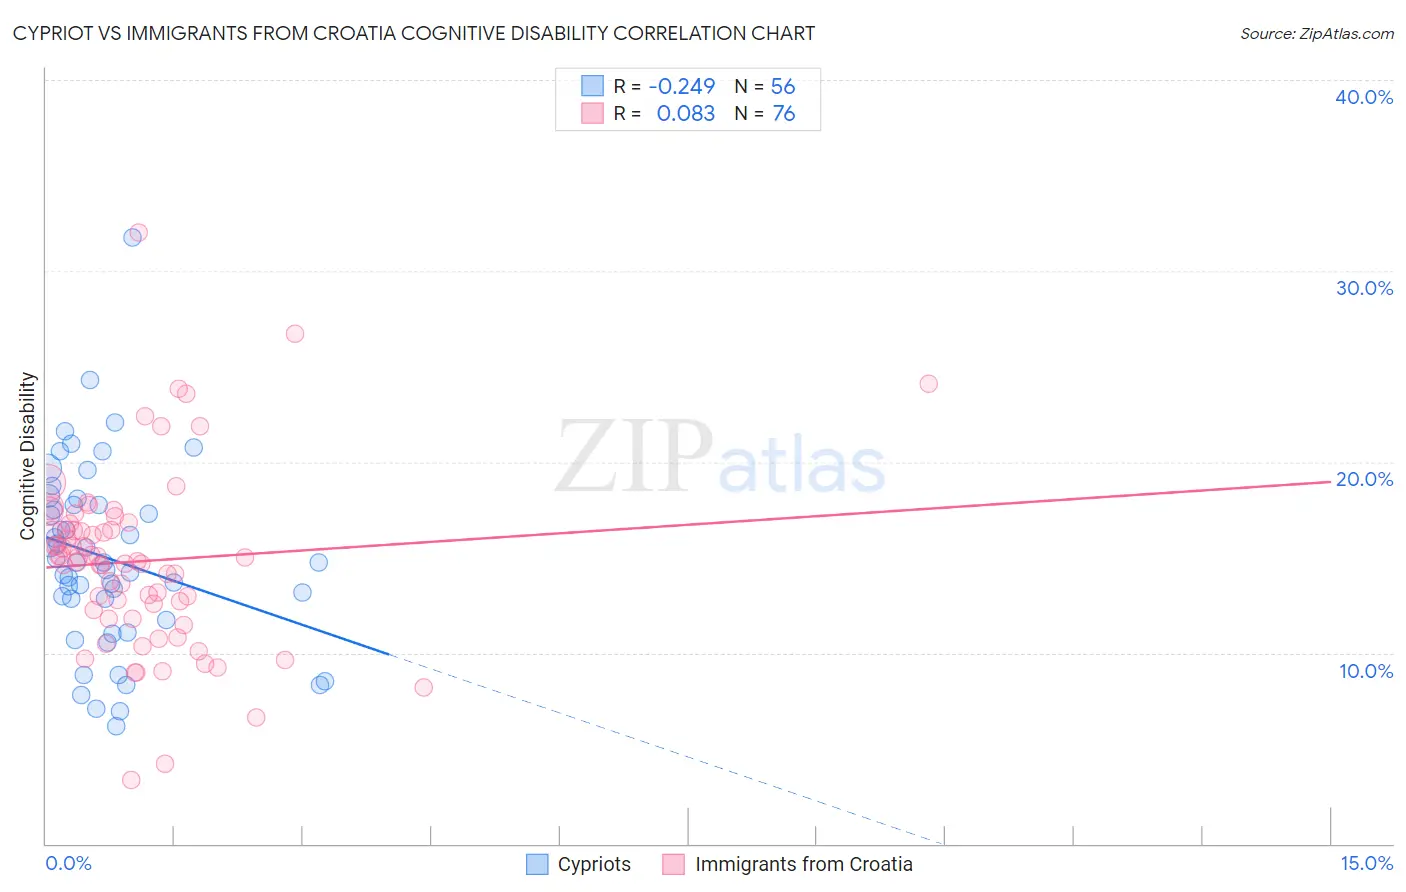
Cypriot vs Immigrants from Croatia Cognitive Disability Correlation Chart
The statistical analysis conducted on geographies consisting of 61,869,277 people shows a weak negative correlation between the proportion of Cypriots and percentage of population with cognitive disability in the United States with a correlation coefficient (R) of -0.249 and weighted average of 17.1%. Similarly, the statistical analysis conducted on geographies consisting of 132,576,983 people shows a slight positive correlation between the proportion of Immigrants from Croatia and percentage of population with cognitive disability in the United States with a correlation coefficient (R) of 0.083 and weighted average of 16.4%, a difference of 4.1%.
Cognitive Disability Correlation Summary
| Measurement | Cypriot | Immigrants from Croatia |
| Minimum | 6.1% | 3.4% |
| Maximum | 31.8% | 32.0% |
| Range | 25.6% | 28.6% |
| Mean | 14.9% | 14.8% |
| Median | 14.7% | 14.9% |
| Interquartile 25% (IQ1) | 12.3% | 12.0% |
| Interquartile 75% (IQ3) | 17.7% | 16.6% |
| Interquartile Range (IQR) | 5.5% | 4.6% |
| Standard Deviation (Sample) | 4.8% | 4.7% |
| Standard Deviation (Population) | 4.8% | 4.7% |
Similar Demographics by Cognitive Disability
Demographics Similar to Cypriots by Cognitive Disability
In terms of cognitive disability, the demographic groups most similar to Cypriots are French Canadian (17.1%, a difference of 0.0%), Scotch-Irish (17.1%, a difference of 0.010%), Basque (17.1%, a difference of 0.010%), Costa Rican (17.0%, a difference of 0.14%), and Syrian (17.1%, a difference of 0.15%).
| Demographics | Rating | Rank | Cognitive Disability |
| Carpatho Rusyns | 89.6 /100 | #142 | Excellent 17.0% |
| British | 89.3 /100 | #143 | Excellent 17.0% |
| Immigrants | Brazil | 89.3 /100 | #144 | Excellent 17.0% |
| Immigrants | South Eastern Asia | 88.7 /100 | #145 | Excellent 17.0% |
| Costa Ricans | 88.0 /100 | #146 | Excellent 17.0% |
| Scotch-Irish | 85.9 /100 | #147 | Excellent 17.1% |
| French Canadians | 85.7 /100 | #148 | Excellent 17.1% |
| Cypriots | 85.7 /100 | #149 | Excellent 17.1% |
| Basques | 85.5 /100 | #150 | Excellent 17.1% |
| Syrians | 83.0 /100 | #151 | Excellent 17.1% |
| Immigrants | Indonesia | 82.7 /100 | #152 | Excellent 17.1% |
| Immigrants | Kazakhstan | 80.5 /100 | #153 | Excellent 17.1% |
| Immigrants | Malaysia | 79.3 /100 | #154 | Good 17.1% |
| Brazilians | 78.9 /100 | #155 | Good 17.1% |
| Sri Lankans | 78.9 /100 | #156 | Good 17.1% |
Demographics Similar to Immigrants from Croatia by Cognitive Disability
In terms of cognitive disability, the demographic groups most similar to Immigrants from Croatia are Immigrants from Pakistan (16.4%, a difference of 0.020%), Polish (16.4%, a difference of 0.020%), Luxembourger (16.4%, a difference of 0.030%), Filipino (16.4%, a difference of 0.050%), and Czech (16.4%, a difference of 0.050%).
| Demographics | Rating | Rank | Cognitive Disability |
| Immigrants | Bolivia | 100.0 /100 | #19 | Exceptional 16.3% |
| Bulgarians | 100.0 /100 | #20 | Exceptional 16.3% |
| Immigrants | Cuba | 100.0 /100 | #21 | Exceptional 16.3% |
| Immigrants | South Central Asia | 99.9 /100 | #22 | Exceptional 16.4% |
| Croatians | 99.9 /100 | #23 | Exceptional 16.4% |
| Immigrants | Argentina | 99.9 /100 | #24 | Exceptional 16.4% |
| Luxembourgers | 99.9 /100 | #25 | Exceptional 16.4% |
| Immigrants | Croatia | 99.9 /100 | #26 | Exceptional 16.4% |
| Immigrants | Pakistan | 99.9 /100 | #27 | Exceptional 16.4% |
| Poles | 99.9 /100 | #28 | Exceptional 16.4% |
| Filipinos | 99.9 /100 | #29 | Exceptional 16.4% |
| Czechs | 99.9 /100 | #30 | Exceptional 16.4% |
| Immigrants | Romania | 99.9 /100 | #31 | Exceptional 16.4% |
| Immigrants | Israel | 99.9 /100 | #32 | Exceptional 16.4% |
| Italians | 99.9 /100 | #33 | Exceptional 16.4% |