Swiss vs Immigrants Cognitive Disability
COMPARE
Swiss
Immigrants
Cognitive Disability
Cognitive Disability Comparison
Swiss
Immigrants
16.7%
COGNITIVE DISABILITY
99.2/ 100
METRIC RATING
82nd/ 347
METRIC RANK
17.2%
COGNITIVE DISABILITY
62.5/ 100
METRIC RATING
168th/ 347
METRIC RANK
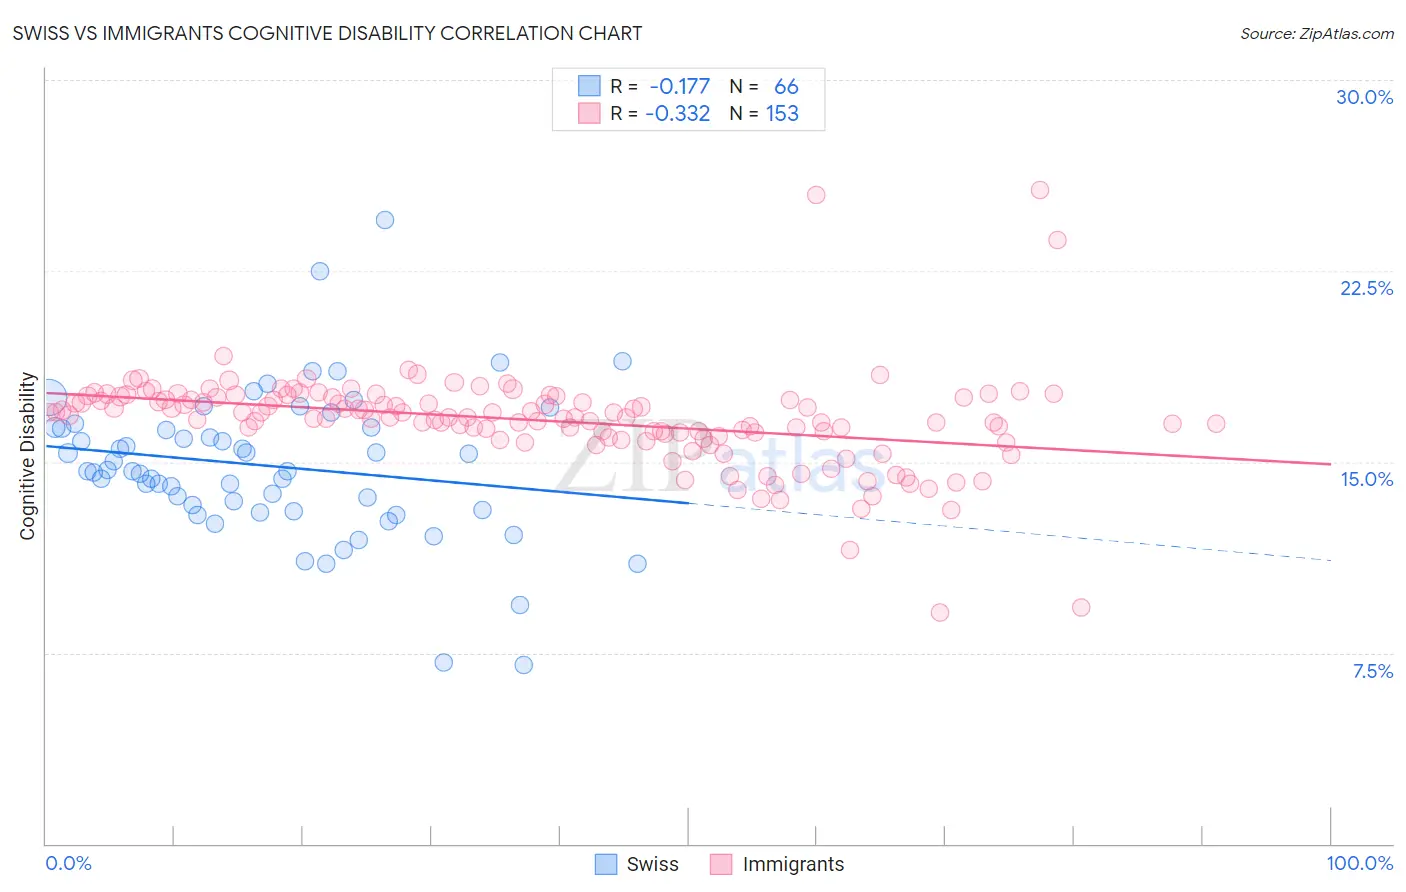
Swiss vs Immigrants Cognitive Disability Correlation Chart
The statistical analysis conducted on geographies consisting of 464,991,468 people shows a poor negative correlation between the proportion of Swiss and percentage of population with cognitive disability in the United States with a correlation coefficient (R) of -0.177 and weighted average of 16.7%. Similarly, the statistical analysis conducted on geographies consisting of 577,580,100 people shows a mild negative correlation between the proportion of Immigrants and percentage of population with cognitive disability in the United States with a correlation coefficient (R) of -0.332 and weighted average of 17.2%, a difference of 3.2%.
Cognitive Disability Correlation Summary
| Measurement | Swiss | Immigrants |
| Minimum | 7.0% | 9.1% |
| Maximum | 24.5% | 25.7% |
| Range | 17.5% | 16.6% |
| Mean | 14.8% | 16.6% |
| Median | 14.6% | 16.8% |
| Interquartile 25% (IQ1) | 13.1% | 16.0% |
| Interquartile 75% (IQ3) | 16.3% | 17.6% |
| Interquartile Range (IQR) | 3.2% | 1.5% |
| Standard Deviation (Sample) | 2.9% | 1.9% |
| Standard Deviation (Population) | 2.9% | 1.9% |
Similar Demographics by Cognitive Disability
Demographics Similar to Swiss by Cognitive Disability
In terms of cognitive disability, the demographic groups most similar to Swiss are Immigrants from Netherlands (16.7%, a difference of 0.030%), Egyptian (16.7%, a difference of 0.040%), Immigrants from Bulgaria (16.7%, a difference of 0.060%), Peruvian (16.7%, a difference of 0.070%), and Serbian (16.7%, a difference of 0.070%).
| Demographics | Rating | Rank | Cognitive Disability |
| Estonians | 99.3 /100 | #75 | Exceptional 16.7% |
| Immigrants | Serbia | 99.3 /100 | #76 | Exceptional 16.7% |
| Immigrants | Hungary | 99.3 /100 | #77 | Exceptional 16.7% |
| Peruvians | 99.3 /100 | #78 | Exceptional 16.7% |
| Immigrants | Bulgaria | 99.3 /100 | #79 | Exceptional 16.7% |
| Egyptians | 99.2 /100 | #80 | Exceptional 16.7% |
| Immigrants | Netherlands | 99.2 /100 | #81 | Exceptional 16.7% |
| Swiss | 99.2 /100 | #82 | Exceptional 16.7% |
| Serbians | 99.1 /100 | #83 | Exceptional 16.7% |
| Belgians | 99.1 /100 | #84 | Exceptional 16.7% |
| Immigrants | Moldova | 99.1 /100 | #85 | Exceptional 16.7% |
| Immigrants | South Africa | 99.0 /100 | #86 | Exceptional 16.7% |
| Native Hawaiians | 99.0 /100 | #87 | Exceptional 16.7% |
| Immigrants | Philippines | 99.0 /100 | #88 | Exceptional 16.7% |
| Immigrants | Egypt | 98.8 /100 | #89 | Exceptional 16.7% |
Demographics Similar to Immigrants by Cognitive Disability
In terms of cognitive disability, the demographic groups most similar to Immigrants are Immigrants from Portugal (17.2%, a difference of 0.020%), Immigrants from Syria (17.2%, a difference of 0.030%), Immigrants from Ecuador (17.2%, a difference of 0.060%), Immigrants from Albania (17.2%, a difference of 0.070%), and Ecuadorian (17.2%, a difference of 0.090%).
| Demographics | Rating | Rank | Cognitive Disability |
| Americans | 72.2 /100 | #161 | Good 17.2% |
| Yugoslavians | 71.6 /100 | #162 | Good 17.2% |
| Immigrants | Switzerland | 71.5 /100 | #163 | Good 17.2% |
| Armenians | 70.1 /100 | #164 | Good 17.2% |
| Immigrants | Albania | 64.9 /100 | #165 | Good 17.2% |
| Immigrants | Ecuador | 64.4 /100 | #166 | Good 17.2% |
| Immigrants | Syria | 63.5 /100 | #167 | Good 17.2% |
| Immigrants | Immigrants | 62.5 /100 | #168 | Good 17.2% |
| Immigrants | Portugal | 61.8 /100 | #169 | Good 17.2% |
| Ecuadorians | 59.6 /100 | #170 | Average 17.2% |
| Tlingit-Haida | 59.4 /100 | #171 | Average 17.2% |
| Immigrants | Turkey | 56.7 /100 | #172 | Average 17.2% |
| Immigrants | Northern Africa | 50.2 /100 | #173 | Average 17.3% |
| Laotians | 50.0 /100 | #174 | Average 17.3% |
| Tsimshian | 49.8 /100 | #175 | Average 17.3% |