Immigrants from Taiwan vs Immigrants Cognitive Disability
COMPARE
Immigrants from Taiwan
Immigrants
Cognitive Disability
Cognitive Disability Comparison
Immigrants from Taiwan
Immigrants
15.7%
COGNITIVE DISABILITY
100.0/ 100
METRIC RATING
1st/ 347
METRIC RANK
17.2%
COGNITIVE DISABILITY
62.5/ 100
METRIC RATING
168th/ 347
METRIC RANK
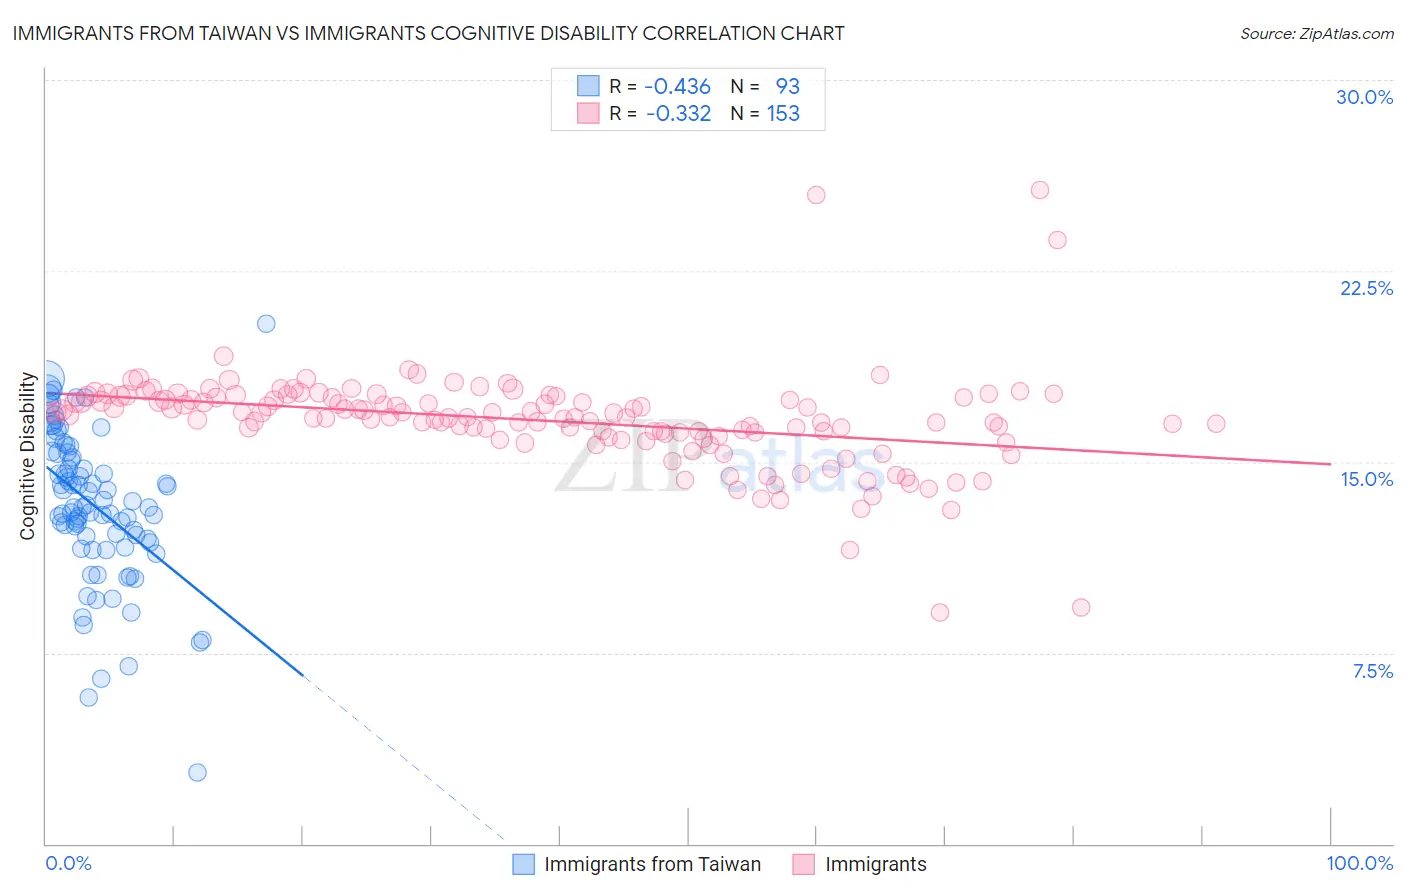
Immigrants from Taiwan vs Immigrants Cognitive Disability Correlation Chart
The statistical analysis conducted on geographies consisting of 298,281,408 people shows a moderate negative correlation between the proportion of Immigrants from Taiwan and percentage of population with cognitive disability in the United States with a correlation coefficient (R) of -0.436 and weighted average of 15.7%. Similarly, the statistical analysis conducted on geographies consisting of 577,580,100 people shows a mild negative correlation between the proportion of Immigrants and percentage of population with cognitive disability in the United States with a correlation coefficient (R) of -0.332 and weighted average of 17.2%, a difference of 9.6%.
Cognitive Disability Correlation Summary
| Measurement | Immigrants from Taiwan | Immigrants |
| Minimum | 2.8% | 9.1% |
| Maximum | 20.4% | 25.7% |
| Range | 17.6% | 16.6% |
| Mean | 13.3% | 16.6% |
| Median | 13.2% | 16.8% |
| Interquartile 25% (IQ1) | 11.9% | 16.0% |
| Interquartile 75% (IQ3) | 15.4% | 17.6% |
| Interquartile Range (IQR) | 3.5% | 1.5% |
| Standard Deviation (Sample) | 3.0% | 1.9% |
| Standard Deviation (Population) | 3.0% | 1.9% |
Similar Demographics by Cognitive Disability
Demographics Similar to Immigrants from Taiwan by Cognitive Disability
In terms of cognitive disability, the demographic groups most similar to Immigrants from Taiwan are Immigrants from India (15.9%, a difference of 1.3%), Chinese (15.9%, a difference of 1.3%), Immigrants from Lithuania (16.0%, a difference of 1.5%), Immigrants from Hong Kong (16.0%, a difference of 1.9%), and Thai (16.1%, a difference of 2.6%).
| Demographics | Rating | Rank | Cognitive Disability |
| Immigrants | Taiwan | 100.0 /100 | #1 | Exceptional 15.7% |
| Immigrants | India | 100.0 /100 | #2 | Exceptional 15.9% |
| Chinese | 100.0 /100 | #3 | Exceptional 15.9% |
| Immigrants | Lithuania | 100.0 /100 | #4 | Exceptional 16.0% |
| Immigrants | Hong Kong | 100.0 /100 | #5 | Exceptional 16.0% |
| Thais | 100.0 /100 | #6 | Exceptional 16.1% |
| Immigrants | Ireland | 100.0 /100 | #7 | Exceptional 16.1% |
| Immigrants | Poland | 100.0 /100 | #8 | Exceptional 16.1% |
| Assyrians/Chaldeans/Syriacs | 100.0 /100 | #9 | Exceptional 16.2% |
| Immigrants | Scotland | 100.0 /100 | #10 | Exceptional 16.2% |
| Immigrants | Czechoslovakia | 100.0 /100 | #11 | Exceptional 16.2% |
| Maltese | 100.0 /100 | #12 | Exceptional 16.2% |
| Lithuanians | 100.0 /100 | #13 | Exceptional 16.3% |
| Immigrants | Austria | 100.0 /100 | #14 | Exceptional 16.3% |
| Immigrants | Greece | 100.0 /100 | #15 | Exceptional 16.3% |
Demographics Similar to Immigrants by Cognitive Disability
In terms of cognitive disability, the demographic groups most similar to Immigrants are Immigrants from Portugal (17.2%, a difference of 0.020%), Immigrants from Syria (17.2%, a difference of 0.030%), Immigrants from Ecuador (17.2%, a difference of 0.060%), Immigrants from Albania (17.2%, a difference of 0.070%), and Ecuadorian (17.2%, a difference of 0.090%).
| Demographics | Rating | Rank | Cognitive Disability |
| Americans | 72.2 /100 | #161 | Good 17.2% |
| Yugoslavians | 71.6 /100 | #162 | Good 17.2% |
| Immigrants | Switzerland | 71.5 /100 | #163 | Good 17.2% |
| Armenians | 70.1 /100 | #164 | Good 17.2% |
| Immigrants | Albania | 64.9 /100 | #165 | Good 17.2% |
| Immigrants | Ecuador | 64.4 /100 | #166 | Good 17.2% |
| Immigrants | Syria | 63.5 /100 | #167 | Good 17.2% |
| Immigrants | Immigrants | 62.5 /100 | #168 | Good 17.2% |
| Immigrants | Portugal | 61.8 /100 | #169 | Good 17.2% |
| Ecuadorians | 59.6 /100 | #170 | Average 17.2% |
| Tlingit-Haida | 59.4 /100 | #171 | Average 17.2% |
| Immigrants | Turkey | 56.7 /100 | #172 | Average 17.2% |
| Immigrants | Northern Africa | 50.2 /100 | #173 | Average 17.3% |
| Laotians | 50.0 /100 | #174 | Average 17.3% |
| Tsimshian | 49.8 /100 | #175 | Average 17.3% |