Immigrants from Northern Africa vs Puget Sound Salish Disability Age Under 5
COMPARE
Immigrants from Northern Africa
Puget Sound Salish
Disability Age Under 5
Disability Age Under 5 Comparison
Immigrants from Northern Africa
Puget Sound Salish
1.2%
DISABILITY AGE UNDER 5
93.8/ 100
METRIC RATING
116th/ 347
METRIC RANK
0.97%
DISABILITY AGE UNDER 5
100.0/ 100
METRIC RATING
19th/ 347
METRIC RANK
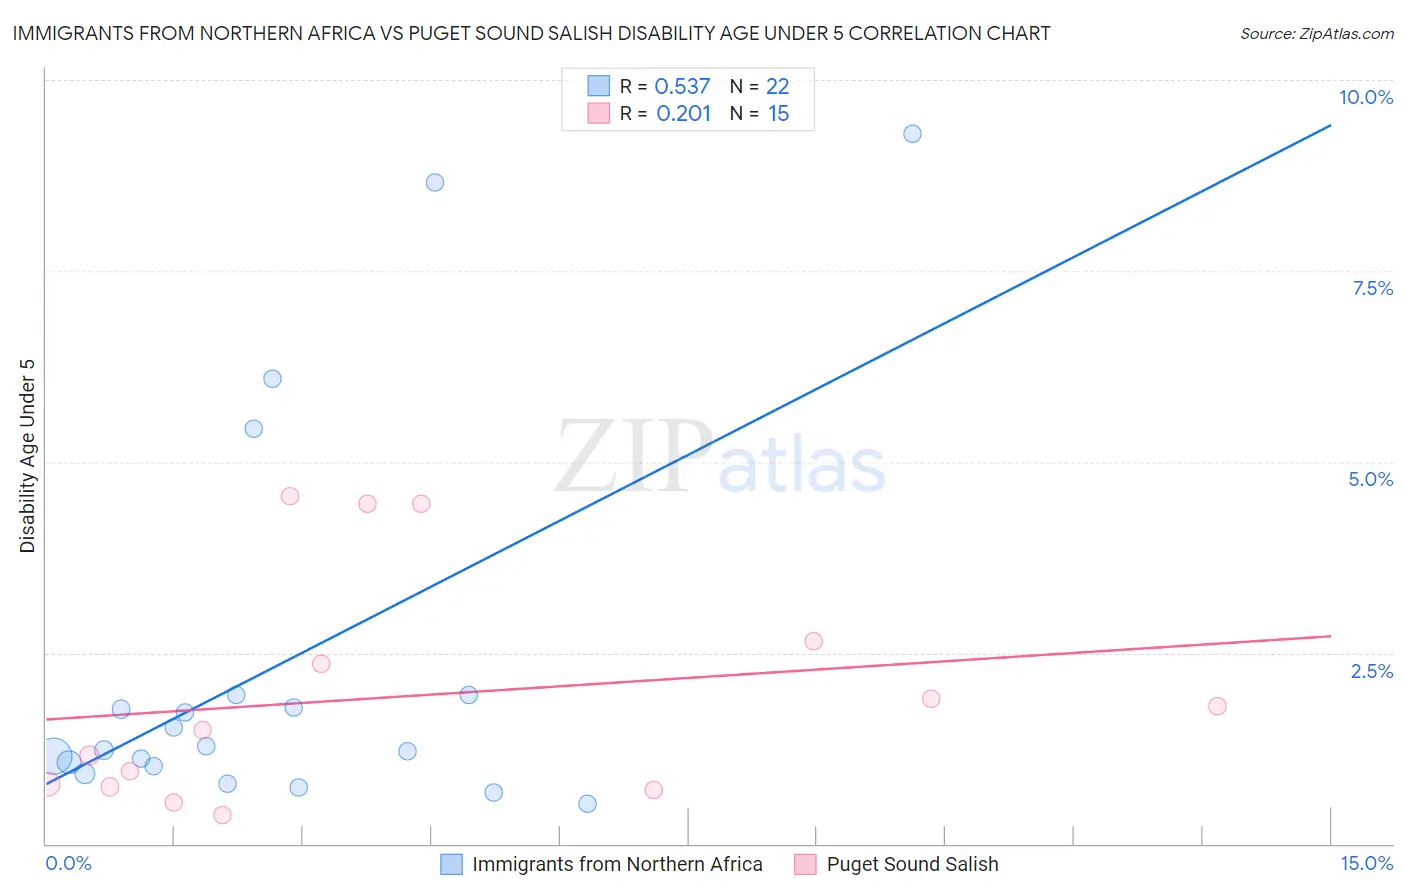
Immigrants from Northern Africa vs Puget Sound Salish Disability Age Under 5 Correlation Chart
The statistical analysis conducted on geographies consisting of 185,664,866 people shows a substantial positive correlation between the proportion of Immigrants from Northern Africa and percentage of population with a disability under the age of 5 in the United States with a correlation coefficient (R) of 0.537 and weighted average of 1.2%. Similarly, the statistical analysis conducted on geographies consisting of 36,173,931 people shows a weak positive correlation between the proportion of Puget Sound Salish and percentage of population with a disability under the age of 5 in the United States with a correlation coefficient (R) of 0.201 and weighted average of 0.97%, a difference of 19.8%.
Disability Age Under 5 Correlation Summary
| Measurement | Immigrants from Northern Africa | Puget Sound Salish |
| Minimum | 0.53% | 0.38% |
| Maximum | 9.3% | 4.5% |
| Range | 8.8% | 4.2% |
| Mean | 2.4% | 1.9% |
| Median | 1.3% | 1.5% |
| Interquartile 25% (IQ1) | 1.0% | 0.75% |
| Interquartile 75% (IQ3) | 1.9% | 2.7% |
| Interquartile Range (IQR) | 0.93% | 1.9% |
| Standard Deviation (Sample) | 2.6% | 1.5% |
| Standard Deviation (Population) | 2.5% | 1.4% |
Similar Demographics by Disability Age Under 5
Demographics Similar to Immigrants from Northern Africa by Disability Age Under 5
In terms of disability age under 5, the demographic groups most similar to Immigrants from Northern Africa are Immigrants from Caribbean (1.2%, a difference of 0.020%), Belizean (1.2%, a difference of 0.030%), Immigrants from Philippines (1.2%, a difference of 0.13%), Immigrants from Venezuela (1.2%, a difference of 0.17%), and Immigrants from Oceania (1.2%, a difference of 0.18%).
| Demographics | Rating | Rank | Disability Age Under 5 |
| Immigrants | Panama | 95.0 /100 | #109 | Exceptional 1.2% |
| Immigrants | Lebanon | 95.0 /100 | #110 | Exceptional 1.2% |
| Senegalese | 94.6 /100 | #111 | Exceptional 1.2% |
| Immigrants | Australia | 94.4 /100 | #112 | Exceptional 1.2% |
| Immigrants | Oceania | 94.2 /100 | #113 | Exceptional 1.2% |
| Belizeans | 93.9 /100 | #114 | Exceptional 1.2% |
| Immigrants | Caribbean | 93.8 /100 | #115 | Exceptional 1.2% |
| Immigrants | Northern Africa | 93.8 /100 | #116 | Exceptional 1.2% |
| Immigrants | Philippines | 93.5 /100 | #117 | Exceptional 1.2% |
| Immigrants | Venezuela | 93.4 /100 | #118 | Exceptional 1.2% |
| Bhutanese | 92.5 /100 | #119 | Exceptional 1.2% |
| Immigrants | Eritrea | 92.3 /100 | #120 | Exceptional 1.2% |
| Immigrants | Senegal | 91.4 /100 | #121 | Exceptional 1.2% |
| Aleuts | 90.7 /100 | #122 | Exceptional 1.2% |
| Zimbabweans | 90.6 /100 | #123 | Exceptional 1.2% |
Demographics Similar to Puget Sound Salish by Disability Age Under 5
In terms of disability age under 5, the demographic groups most similar to Puget Sound Salish are Nepalese (0.97%, a difference of 0.10%), Immigrants from Barbados (0.97%, a difference of 0.37%), Immigrants from China (0.96%, a difference of 0.95%), Immigrants from Israel (0.96%, a difference of 1.4%), and British West Indian (0.99%, a difference of 1.9%).
| Demographics | Rating | Rank | Disability Age Under 5 |
| Immigrants | Grenada | 100.0 /100 | #12 | Exceptional 0.94% |
| Soviet Union | 100.0 /100 | #13 | Exceptional 0.95% |
| Yuman | 100.0 /100 | #14 | Exceptional 0.95% |
| Immigrants | Hong Kong | 100.0 /100 | #15 | Exceptional 0.95% |
| Immigrants | Israel | 100.0 /100 | #16 | Exceptional 0.96% |
| Immigrants | China | 100.0 /100 | #17 | Exceptional 0.96% |
| Immigrants | Barbados | 100.0 /100 | #18 | Exceptional 0.97% |
| Puget Sound Salish | 100.0 /100 | #19 | Exceptional 0.97% |
| Nepalese | 100.0 /100 | #20 | Exceptional 0.97% |
| British West Indians | 100.0 /100 | #21 | Exceptional 0.99% |
| Immigrants | Iran | 100.0 /100 | #22 | Exceptional 1.00% |
| Yakama | 100.0 /100 | #23 | Exceptional 1.00% |
| Indians (Asian) | 100.0 /100 | #24 | Exceptional 1.0% |
| Immigrants | Micronesia | 100.0 /100 | #25 | Exceptional 1.0% |
| Immigrants | Taiwan | 100.0 /100 | #26 | Exceptional 1.0% |