Cuban vs Puget Sound Salish In Labor Force | Age > 16
COMPARE
Cuban
Puget Sound Salish
In Labor Force | Age > 16
In Labor Force | Age > 16 Comparison
Cubans
Puget Sound Salish
64.2%
IN LABOR FORCE | AGE > 16
0.5/ 100
METRIC RATING
265th/ 347
METRIC RANK
63.7%
IN LABOR FORCE | AGE > 16
0.0/ 100
METRIC RATING
294th/ 347
METRIC RANK
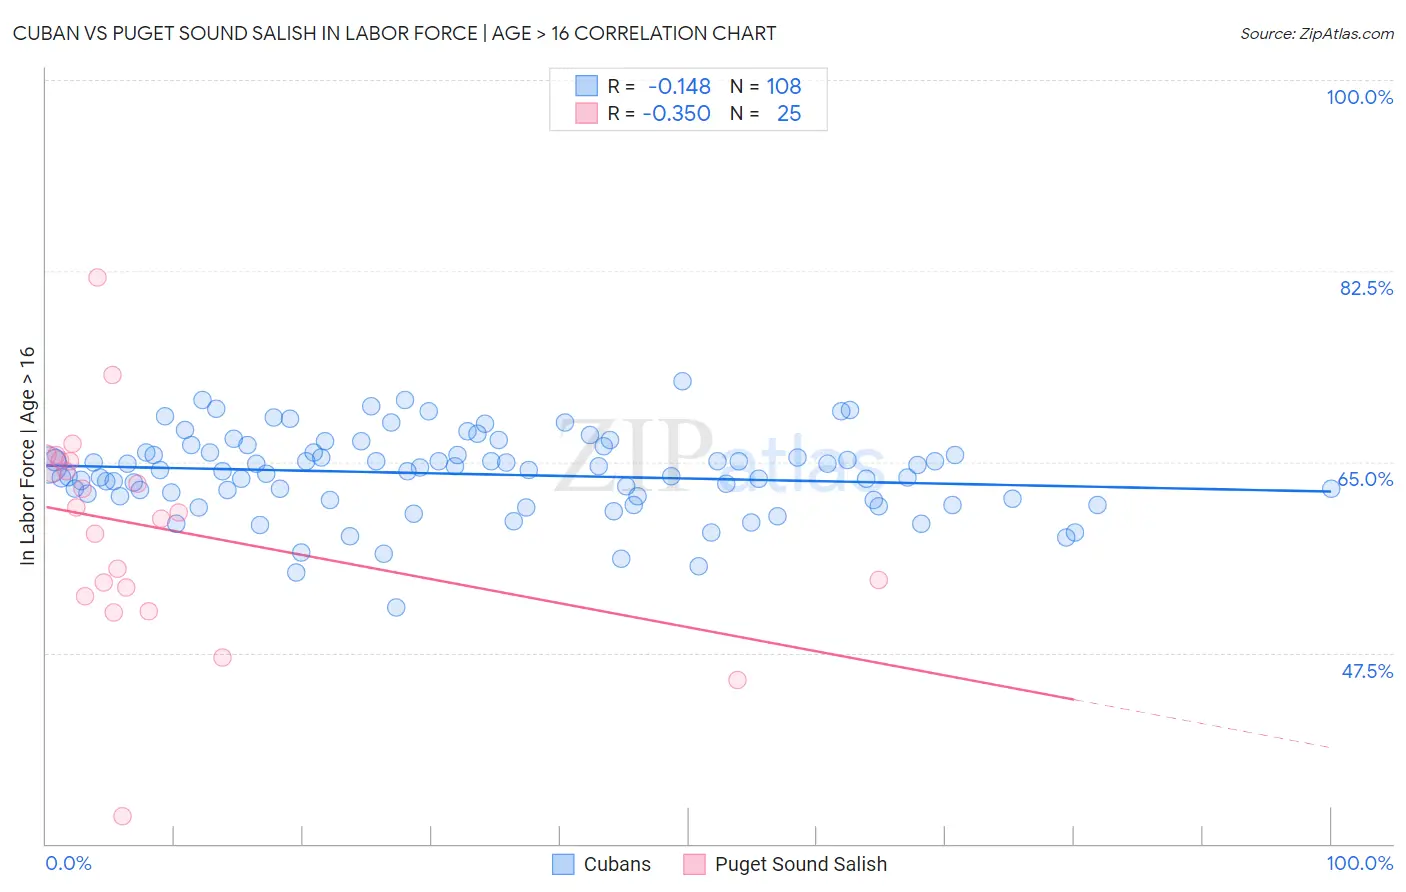
Cuban vs Puget Sound Salish In Labor Force | Age > 16 Correlation Chart
The statistical analysis conducted on geographies consisting of 449,375,303 people shows a poor negative correlation between the proportion of Cubans and labor force participation rate among population ages 16 and over in the United States with a correlation coefficient (R) of -0.148 and weighted average of 64.2%. Similarly, the statistical analysis conducted on geographies consisting of 46,155,746 people shows a mild negative correlation between the proportion of Puget Sound Salish and labor force participation rate among population ages 16 and over in the United States with a correlation coefficient (R) of -0.350 and weighted average of 63.7%, a difference of 0.68%.
In Labor Force | Age > 16 Correlation Summary
| Measurement | Cuban | Puget Sound Salish |
| Minimum | 51.6% | 32.5% |
| Maximum | 72.4% | 81.9% |
| Range | 20.8% | 49.4% |
| Mean | 63.9% | 58.9% |
| Median | 64.3% | 60.4% |
| Interquartile 25% (IQ1) | 61.7% | 53.1% |
| Interquartile 75% (IQ3) | 65.9% | 65.1% |
| Interquartile Range (IQR) | 4.2% | 12.0% |
| Standard Deviation (Sample) | 3.7% | 9.8% |
| Standard Deviation (Population) | 3.7% | 9.6% |
Similar Demographics by In Labor Force | Age > 16
Demographics Similar to Cubans by In Labor Force | Age > 16
In terms of in labor force | age > 16, the demographic groups most similar to Cubans are Immigrants from England (64.2%, a difference of 0.010%), Canadian (64.1%, a difference of 0.020%), Spaniard (64.1%, a difference of 0.020%), Dutch (64.2%, a difference of 0.040%), and Bahamian (64.2%, a difference of 0.060%).
| Demographics | Rating | Rank | In Labor Force | Age > 16 |
| Immigrants | Scotland | 0.8 /100 | #258 | Tragic 64.2% |
| Immigrants | Western Europe | 0.7 /100 | #259 | Tragic 64.2% |
| Marshallese | 0.7 /100 | #260 | Tragic 64.2% |
| Basques | 0.7 /100 | #261 | Tragic 64.2% |
| Finns | 0.7 /100 | #262 | Tragic 64.2% |
| Bahamians | 0.6 /100 | #263 | Tragic 64.2% |
| Dutch | 0.6 /100 | #264 | Tragic 64.2% |
| Cubans | 0.5 /100 | #265 | Tragic 64.2% |
| Immigrants | England | 0.5 /100 | #266 | Tragic 64.2% |
| Canadians | 0.5 /100 | #267 | Tragic 64.1% |
| Spaniards | 0.5 /100 | #268 | Tragic 64.1% |
| Irish | 0.4 /100 | #269 | Tragic 64.1% |
| Guyanese | 0.4 /100 | #270 | Tragic 64.1% |
| Dominicans | 0.4 /100 | #271 | Tragic 64.1% |
| Native Hawaiians | 0.3 /100 | #272 | Tragic 64.1% |
Demographics Similar to Puget Sound Salish by In Labor Force | Age > 16
In terms of in labor force | age > 16, the demographic groups most similar to Puget Sound Salish are English (63.7%, a difference of 0.030%), Immigrants from Canada (63.7%, a difference of 0.050%), Spanish American Indian (63.8%, a difference of 0.070%), Immigrants from North America (63.7%, a difference of 0.070%), and Nepalese (63.8%, a difference of 0.13%).
| Demographics | Rating | Rank | In Labor Force | Age > 16 |
| Scottish | 0.1 /100 | #287 | Tragic 63.9% |
| Spanish | 0.1 /100 | #288 | Tragic 63.9% |
| Celtics | 0.1 /100 | #289 | Tragic 63.8% |
| Hungarians | 0.1 /100 | #290 | Tragic 63.8% |
| Nepalese | 0.1 /100 | #291 | Tragic 63.8% |
| Spanish American Indians | 0.1 /100 | #292 | Tragic 63.8% |
| English | 0.1 /100 | #293 | Tragic 63.7% |
| Puget Sound Salish | 0.0 /100 | #294 | Tragic 63.7% |
| Immigrants | Canada | 0.0 /100 | #295 | Tragic 63.7% |
| Immigrants | North America | 0.0 /100 | #296 | Tragic 63.7% |
| Immigrants | Grenada | 0.0 /100 | #297 | Tragic 63.6% |
| Comanche | 0.0 /100 | #298 | Tragic 63.6% |
| Whites/Caucasians | 0.0 /100 | #299 | Tragic 63.6% |
| Immigrants | Azores | 0.0 /100 | #300 | Tragic 63.6% |
| Spanish Americans | 0.0 /100 | #301 | Tragic 63.6% |