Cuban vs Iroquois Ambulatory Disability
COMPARE
Cuban
Iroquois
Ambulatory Disability
Ambulatory Disability Comparison
Cubans
Iroquois
6.4%
AMBULATORY DISABILITY
4.0/ 100
METRIC RATING
227th/ 347
METRIC RANK
7.1%
AMBULATORY DISABILITY
0.0/ 100
METRIC RATING
306th/ 347
METRIC RANK
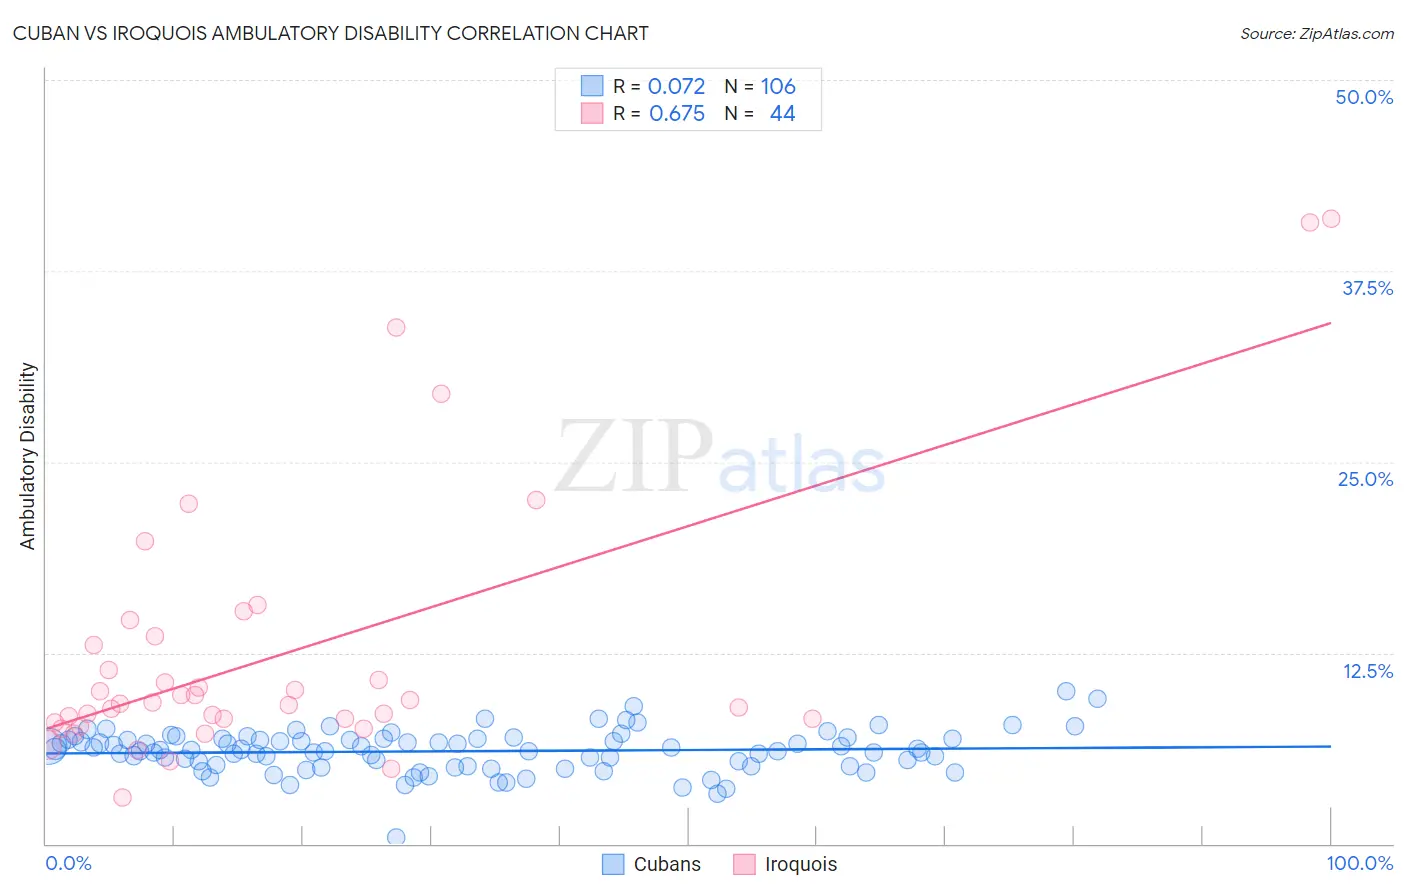
Cuban vs Iroquois Ambulatory Disability Correlation Chart
The statistical analysis conducted on geographies consisting of 449,114,501 people shows a slight positive correlation between the proportion of Cubans and percentage of population with ambulatory disability in the United States with a correlation coefficient (R) of 0.072 and weighted average of 6.4%. Similarly, the statistical analysis conducted on geographies consisting of 207,272,935 people shows a significant positive correlation between the proportion of Iroquois and percentage of population with ambulatory disability in the United States with a correlation coefficient (R) of 0.675 and weighted average of 7.1%, a difference of 10.6%.
Ambulatory Disability Correlation Summary
| Measurement | Cuban | Iroquois |
| Minimum | 0.45% | 3.0% |
| Maximum | 10.0% | 40.9% |
| Range | 9.5% | 37.9% |
| Mean | 6.1% | 12.5% |
| Median | 6.1% | 9.2% |
| Interquartile 25% (IQ1) | 5.1% | 8.0% |
| Interquartile 75% (IQ3) | 6.9% | 13.3% |
| Interquartile Range (IQR) | 1.7% | 5.2% |
| Standard Deviation (Sample) | 1.4% | 8.7% |
| Standard Deviation (Population) | 1.4% | 8.6% |
Similar Demographics by Ambulatory Disability
Demographics Similar to Cubans by Ambulatory Disability
In terms of ambulatory disability, the demographic groups most similar to Cubans are Portuguese (6.4%, a difference of 0.010%), Czechoslovakian (6.4%, a difference of 0.060%), Mexican (6.4%, a difference of 0.17%), Panamanian (6.4%, a difference of 0.32%), and Slavic (6.4%, a difference of 0.33%).
| Demographics | Rating | Rank | Ambulatory Disability |
| Immigrants | Albania | 9.6 /100 | #220 | Tragic 6.3% |
| Hungarians | 9.6 /100 | #221 | Tragic 6.3% |
| German Russians | 9.4 /100 | #222 | Tragic 6.3% |
| Immigrants | Honduras | 7.6 /100 | #223 | Tragic 6.3% |
| Liberians | 7.1 /100 | #224 | Tragic 6.3% |
| Hondurans | 6.3 /100 | #225 | Tragic 6.3% |
| Slavs | 5.1 /100 | #226 | Tragic 6.4% |
| Cubans | 4.0 /100 | #227 | Tragic 6.4% |
| Portuguese | 4.0 /100 | #228 | Tragic 6.4% |
| Czechoslovakians | 3.8 /100 | #229 | Tragic 6.4% |
| Mexicans | 3.5 /100 | #230 | Tragic 6.4% |
| Panamanians | 3.1 /100 | #231 | Tragic 6.4% |
| Assyrians/Chaldeans/Syriacs | 2.4 /100 | #232 | Tragic 6.4% |
| Sub-Saharan Africans | 2.3 /100 | #233 | Tragic 6.4% |
| Immigrants | Liberia | 2.3 /100 | #234 | Tragic 6.4% |
Demographics Similar to Iroquois by Ambulatory Disability
In terms of ambulatory disability, the demographic groups most similar to Iroquois are Spanish American (7.1%, a difference of 0.26%), Chippewa (7.1%, a difference of 0.27%), Immigrants from the Azores (7.1%, a difference of 0.44%), Immigrants from Micronesia (7.0%, a difference of 0.53%), and Arapaho (7.1%, a difference of 0.72%).
| Demographics | Rating | Rank | Ambulatory Disability |
| Puget Sound Salish | 0.0 /100 | #299 | Tragic 6.9% |
| Marshallese | 0.0 /100 | #300 | Tragic 6.9% |
| British West Indians | 0.0 /100 | #301 | Tragic 7.0% |
| Immigrants | Armenia | 0.0 /100 | #302 | Tragic 7.0% |
| Africans | 0.0 /100 | #303 | Tragic 7.0% |
| Immigrants | Cabo Verde | 0.0 /100 | #304 | Tragic 7.0% |
| Immigrants | Micronesia | 0.0 /100 | #305 | Tragic 7.0% |
| Iroquois | 0.0 /100 | #306 | Tragic 7.1% |
| Spanish Americans | 0.0 /100 | #307 | Tragic 7.1% |
| Chippewa | 0.0 /100 | #308 | Tragic 7.1% |
| Immigrants | Azores | 0.0 /100 | #309 | Tragic 7.1% |
| Arapaho | 0.0 /100 | #310 | Tragic 7.1% |
| Cree | 0.0 /100 | #311 | Tragic 7.1% |
| Delaware | 0.0 /100 | #312 | Tragic 7.1% |
| Immigrants | Yemen | 0.0 /100 | #313 | Tragic 7.1% |