Cuban vs Immigrants from Kazakhstan Ambulatory Disability
COMPARE
Cuban
Immigrants from Kazakhstan
Ambulatory Disability
Ambulatory Disability Comparison
Cubans
Immigrants from Kazakhstan
6.4%
AMBULATORY DISABILITY
4.0/ 100
METRIC RATING
227th/ 347
METRIC RANK
5.9%
AMBULATORY DISABILITY
89.7/ 100
METRIC RATING
130th/ 347
METRIC RANK
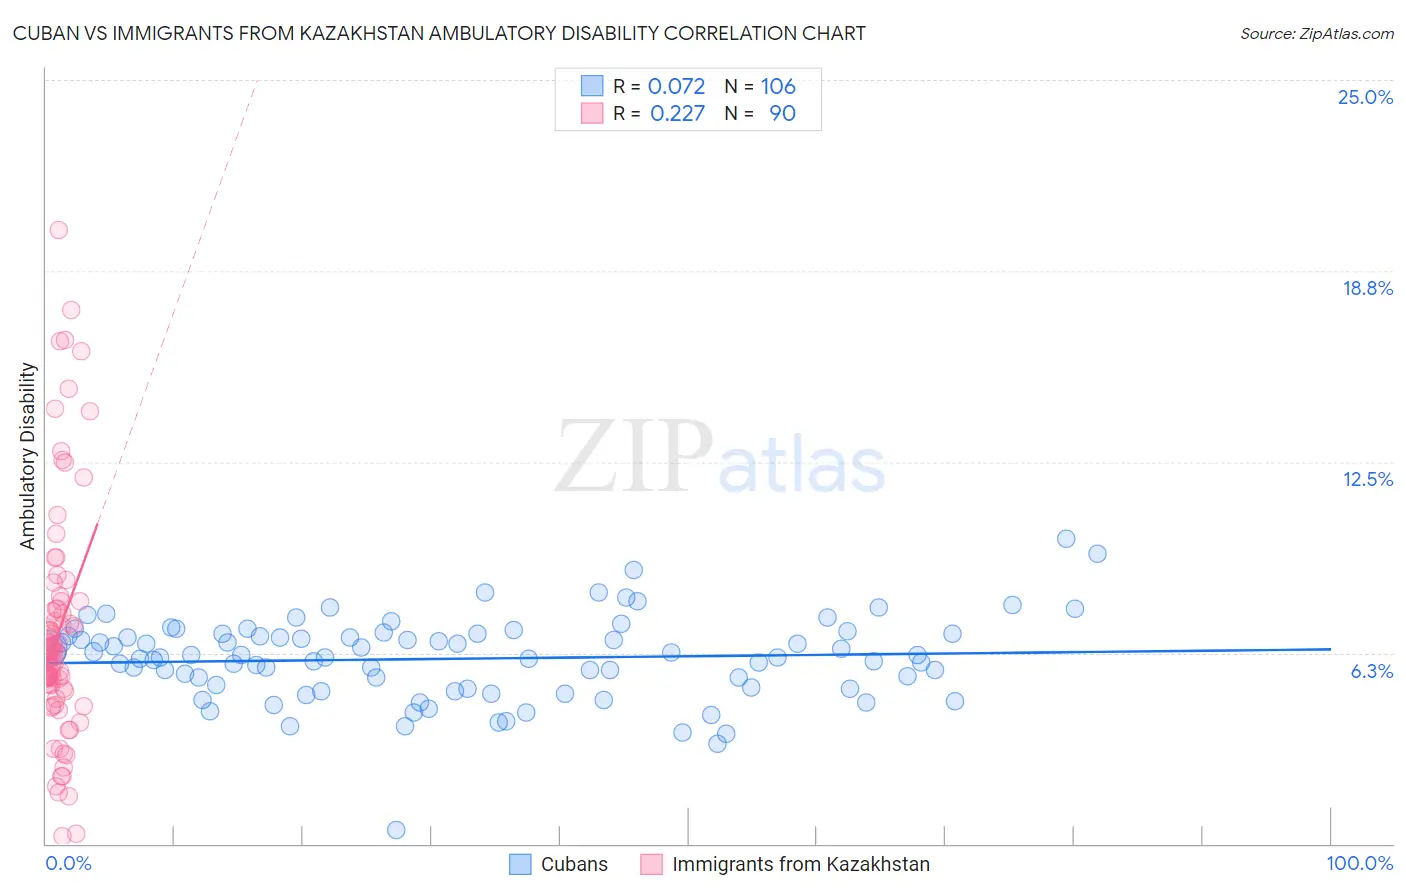
Cuban vs Immigrants from Kazakhstan Ambulatory Disability Correlation Chart
The statistical analysis conducted on geographies consisting of 449,114,501 people shows a slight positive correlation between the proportion of Cubans and percentage of population with ambulatory disability in the United States with a correlation coefficient (R) of 0.072 and weighted average of 6.4%. Similarly, the statistical analysis conducted on geographies consisting of 124,443,278 people shows a weak positive correlation between the proportion of Immigrants from Kazakhstan and percentage of population with ambulatory disability in the United States with a correlation coefficient (R) of 0.227 and weighted average of 5.9%, a difference of 7.3%.
Ambulatory Disability Correlation Summary
| Measurement | Cuban | Immigrants from Kazakhstan |
| Minimum | 0.45% | 0.25% |
| Maximum | 10.0% | 20.1% |
| Range | 9.5% | 19.9% |
| Mean | 6.1% | 6.9% |
| Median | 6.1% | 6.2% |
| Interquartile 25% (IQ1) | 5.1% | 5.1% |
| Interquartile 75% (IQ3) | 6.9% | 7.7% |
| Interquartile Range (IQR) | 1.7% | 2.6% |
| Standard Deviation (Sample) | 1.4% | 3.8% |
| Standard Deviation (Population) | 1.4% | 3.8% |
Similar Demographics by Ambulatory Disability
Demographics Similar to Cubans by Ambulatory Disability
In terms of ambulatory disability, the demographic groups most similar to Cubans are Portuguese (6.4%, a difference of 0.010%), Czechoslovakian (6.4%, a difference of 0.060%), Mexican (6.4%, a difference of 0.17%), Panamanian (6.4%, a difference of 0.32%), and Slavic (6.4%, a difference of 0.33%).
| Demographics | Rating | Rank | Ambulatory Disability |
| Immigrants | Albania | 9.6 /100 | #220 | Tragic 6.3% |
| Hungarians | 9.6 /100 | #221 | Tragic 6.3% |
| German Russians | 9.4 /100 | #222 | Tragic 6.3% |
| Immigrants | Honduras | 7.6 /100 | #223 | Tragic 6.3% |
| Liberians | 7.1 /100 | #224 | Tragic 6.3% |
| Hondurans | 6.3 /100 | #225 | Tragic 6.3% |
| Slavs | 5.1 /100 | #226 | Tragic 6.4% |
| Cubans | 4.0 /100 | #227 | Tragic 6.4% |
| Portuguese | 4.0 /100 | #228 | Tragic 6.4% |
| Czechoslovakians | 3.8 /100 | #229 | Tragic 6.4% |
| Mexicans | 3.5 /100 | #230 | Tragic 6.4% |
| Panamanians | 3.1 /100 | #231 | Tragic 6.4% |
| Assyrians/Chaldeans/Syriacs | 2.4 /100 | #232 | Tragic 6.4% |
| Sub-Saharan Africans | 2.3 /100 | #233 | Tragic 6.4% |
| Immigrants | Liberia | 2.3 /100 | #234 | Tragic 6.4% |
Demographics Similar to Immigrants from Kazakhstan by Ambulatory Disability
In terms of ambulatory disability, the demographic groups most similar to Immigrants from Kazakhstan are Immigrants from Costa Rica (5.9%, a difference of 0.030%), Immigrants from Norway (5.9%, a difference of 0.11%), Immigrants from Western Asia (5.9%, a difference of 0.14%), Immigrants from Nigeria (5.9%, a difference of 0.18%), and Immigrants from Europe (6.0%, a difference of 0.27%).
| Demographics | Rating | Rank | Ambulatory Disability |
| Immigrants | Russia | 92.4 /100 | #123 | Exceptional 5.9% |
| Immigrants | Middle Africa | 92.2 /100 | #124 | Exceptional 5.9% |
| Koreans | 91.6 /100 | #125 | Exceptional 5.9% |
| Arabs | 91.5 /100 | #126 | Exceptional 5.9% |
| Immigrants | Nigeria | 90.9 /100 | #127 | Exceptional 5.9% |
| Immigrants | Western Asia | 90.7 /100 | #128 | Exceptional 5.9% |
| Immigrants | Norway | 90.5 /100 | #129 | Exceptional 5.9% |
| Immigrants | Kazakhstan | 89.7 /100 | #130 | Excellent 5.9% |
| Immigrants | Costa Rica | 89.5 /100 | #131 | Excellent 5.9% |
| Immigrants | Europe | 87.8 /100 | #132 | Excellent 6.0% |
| Immigrants | Immigrants | 86.9 /100 | #133 | Excellent 6.0% |
| Ute | 86.6 /100 | #134 | Excellent 6.0% |
| Immigrants | Italy | 85.0 /100 | #135 | Excellent 6.0% |
| Immigrants | North Macedonia | 84.1 /100 | #136 | Excellent 6.0% |
| Immigrants | Syria | 84.1 /100 | #137 | Excellent 6.0% |