Egyptian vs Immigrants from Kazakhstan Ambulatory Disability

COMPARE

Egyptian
Race
Ancestry
AfghanAfricanAlaska NativeAlaskan AthabascanAlbanianAleutAlsatianAmericanApacheArabArapahoArgentineanArmenianAssyrian/Chaldean/SyriacAustralianAustrianBahamianBangladeshiBarbadianBasqueBelgianBelizeanBermudanBhutaneseBlackfeetBolivianBrazilianBritishBritish West IndianBulgarianBurmeseCajunCambodianCanadianCape VerdeanCarpatho RusynCelticCentral AmericanCentral American IndianCherokeeCheyenneChickasawChileanChineseChippewaChoctawColombianColvilleComancheCosta RicanCreeCreekCroatianCrowCubanCypriotCzechCzechoslovakianDanishDelawareDominicanDutchDutch West IndianEastern EuropeanEcuadorianEgyptianEnglishEstonianEthiopianEuropeanFijianFilipinoFinnishFrenchFrench American IndianFrench CanadianGermanGerman RussianGhanaianGreekGuamanian/ChamorroGuatemalanGuyaneseHaitianHmongHonduranHopiHoumaHungarianIcelanderIndian (Asian)IndonesianInupiatIranianIraqiIrishIroquoisIsraeliItalianJamaicanJapaneseJordanianKenyanKiowaKoreanLaotianLatvianLebaneseLiberianLithuanianLumbeeLuxembourgerMacedonianMalaysianMalteseMarshalleseMenomineeMexicanMexican American IndianMongolianMoroccanNative HawaiianNavajoNepaleseNew ZealanderNicaraguanNigerianNorthern EuropeanNorwegianOkinawanOsageOttawaPaiutePakistaniPalestinianPanamanianParaguayanPennsylvania GermanPeruvianPimaPolishPortuguesePotawatomiPuebloPuerto RicanPuget Sound SalishRomanianRussianSalvadoranSamoanScandinavianScotch-IrishScottishSeminoleSenegaleseSerbianShoshoneSierra LeoneanSiouxSlavicSlovakSloveneSomaliSouth AfricanSouth AmericanSouth American IndianSoviet UnionSpaniardSpanishSpanish AmericanSpanish American IndianSri LankanSubsaharan AfricanSudaneseSwedishSwissSyrianTaiwaneseThaiTlingit-HaidaTohono O'OdhamTonganTrinidadian and TobagonianTsimshianTurkishU.S. Virgin IslanderUgandanUkrainianUruguayanUteVenezuelanVietnameseWelshWest IndianYakamaYaquiYugoslavianYumanYup'ikZimbabwean
Immigration
NonimmigrantsImmigrantsAfghanistanAfricaAlbaniaArgentinaArmeniaAsiaAustraliaAustriaBahamasBangladeshBarbadosBelarusBelgiumBelizeBoliviaBosnia and HerzegovinaBrazilBulgariaBurma/MyanmarCabo VerdeCambodiaCameroonCanadaCaribbeanCentral AmericaChileChinaColombiaCongoCosta RicaCroatiaCubaCzechoslovakiaDenmarkDominicaDominican RepublicEastern AfricaEastern AsiaEastern EuropeEcuadorEgyptEl SalvadorEnglandEritreaEthiopiaEuropeFijiFranceGermanyGhanaGreeceGrenadaGuatemalaGuyanaHaitiHondurasHong KongHungaryIndiaIndonesiaIranIraqIrelandIsraelItalyJamaicaJapanJordanKenyaKoreaKuwaitLaosLatin AmericaLatviaLebanonLiberiaLithuaniaMalaysiaMexicoMicronesiaMiddle AfricaMoldovaMoroccoNepalNetherlandsNicaraguaNigeriaNorth AmericaNorth MacedoniaNorthern AfricaNorthern EuropeNorwayOceaniaPakistanPanamaPeruPhilippinesPolandPortugalRomaniaRussiaSaudi ArabiaScotlandSenegalSerbiaSierra LeoneSingaporeSomaliaSouth AfricaSouth AmericaSouth Central AsiaSouth Eastern AsiaSouthern EuropeSpainSri LankaSt. Vincent and the GrenadinesSudanSwedenSwitzerlandSyriaTaiwanThailandTrinidad and TobagoTurkeyUgandaUkraineUruguayUzbekistanVenezuelaVietnamWest IndiesWestern AfricaWestern AsiaWestern EuropeYemenZaireZimbabweAzores
Immigrants from Kazakhstan
Race
Ancestry
AfghanAfricanAlaska NativeAlaskan AthabascanAlbanianAleutAlsatianAmericanApacheArabArapahoArgentineanArmenianAssyrian/Chaldean/SyriacAustralianAustrianBahamianBangladeshiBarbadianBasqueBelgianBelizeanBermudanBhutaneseBlackfeetBolivianBrazilianBritishBritish West IndianBulgarianBurmeseCajunCambodianCanadianCape VerdeanCarpatho RusynCelticCentral AmericanCentral American IndianCherokeeCheyenneChickasawChileanChineseChippewaChoctawColombianColvilleComancheCosta RicanCreeCreekCroatianCrowCubanCypriotCzechCzechoslovakianDanishDelawareDominicanDutchDutch West IndianEastern EuropeanEcuadorianEnglishEstonianEthiopianEuropeanFijianFilipinoFinnishFrenchFrench American IndianFrench CanadianGermanGerman RussianGhanaianGreekGuamanian/ChamorroGuatemalanGuyaneseHaitianHmongHonduranHopiHoumaHungarianIcelanderIndian (Asian)IndonesianInupiatIranianIraqiIrishIroquoisIsraeliItalianJamaicanJapaneseJordanianKenyanKiowaKoreanLaotianLatvianLebaneseLiberianLithuanianLumbeeLuxembourgerMacedonianMalaysianMalteseMarshalleseMenomineeMexicanMexican American IndianMongolianMoroccanNative HawaiianNavajoNepaleseNew ZealanderNicaraguanNigerianNorthern EuropeanNorwegianOkinawanOsageOttawaPaiutePakistaniPalestinianPanamanianParaguayanPennsylvania GermanPeruvianPimaPolishPortuguesePotawatomiPuebloPuerto RicanPuget Sound SalishRomanianRussianSalvadoranSamoanScandinavianScotch-IrishScottishSeminoleSenegaleseSerbianShoshoneSierra LeoneanSiouxSlavicSlovakSloveneSomaliSouth AfricanSouth AmericanSouth American IndianSoviet UnionSpaniardSpanishSpanish AmericanSpanish American IndianSri LankanSubsaharan AfricanSudaneseSwedishSwissSyrianTaiwaneseThaiTlingit-HaidaTohono O'OdhamTonganTrinidadian and TobagonianTsimshianTurkishU.S. Virgin IslanderUgandanUkrainianUruguayanUteVenezuelanVietnameseWelshWest IndianYakamaYaquiYugoslavianYumanYup'ikZimbabwean
Immigration
NonimmigrantsImmigrantsAfghanistanAfricaAlbaniaArgentinaArmeniaAsiaAustraliaAustriaBahamasBangladeshBarbadosBelarusBelgiumBelizeBoliviaBosnia and HerzegovinaBrazilBulgariaBurma/MyanmarCabo VerdeCambodiaCameroonCanadaCaribbeanCentral AmericaChileChinaColombiaCongoCosta RicaCroatiaCubaCzechoslovakiaDenmarkDominicaDominican RepublicEastern AfricaEastern AsiaEastern EuropeEcuadorEgyptEl SalvadorEnglandEritreaEthiopiaEuropeFijiFranceGermanyGhanaGreeceGrenadaGuatemalaGuyanaHaitiHondurasHong KongHungaryIndiaIndonesiaIranIraqIrelandIsraelItalyJamaicaJapanJordanKazakhstanKenyaKoreaKuwaitLaosLatin AmericaLatviaLebanonLiberiaLithuaniaMalaysiaMexicoMicronesiaMiddle AfricaMoldovaMoroccoNepalNetherlandsNicaraguaNigeriaNorth AmericaNorth MacedoniaNorthern AfricaNorthern EuropeNorwayOceaniaPakistanPanamaPeruPhilippinesPolandPortugalRomaniaRussiaSaudi ArabiaScotlandSenegalSerbiaSierra LeoneSingaporeSomaliaSouth AfricaSouth AmericaSouth Central AsiaSouth Eastern AsiaSouthern EuropeSpainSri LankaSt. Vincent and the GrenadinesSudanSwedenSwitzerlandSyriaTaiwanThailandTrinidad and TobagoTurkeyUgandaUkraineUruguayUzbekistanVenezuelaVietnamWest IndiesWestern AfricaWestern AsiaWestern EuropeYemenZaireZimbabweAzores
Ambulatory Disability
Income
Poverty
Unemployment
Labor Participation
Family Structure
Vehicle Availability
Education Level
Disability

Ambulatory Disability Comparison

Egyptians

Immigrants from Kazakhstan

Exceptional
Excellent
5.6%
AMBULATORY DISABILITY
99.9/ 100
METRIC RATING
46th/ 347
METRIC RANK
5.9%
AMBULATORY DISABILITY
89.7/ 100
METRIC RATING
130th/ 347
METRIC RANK

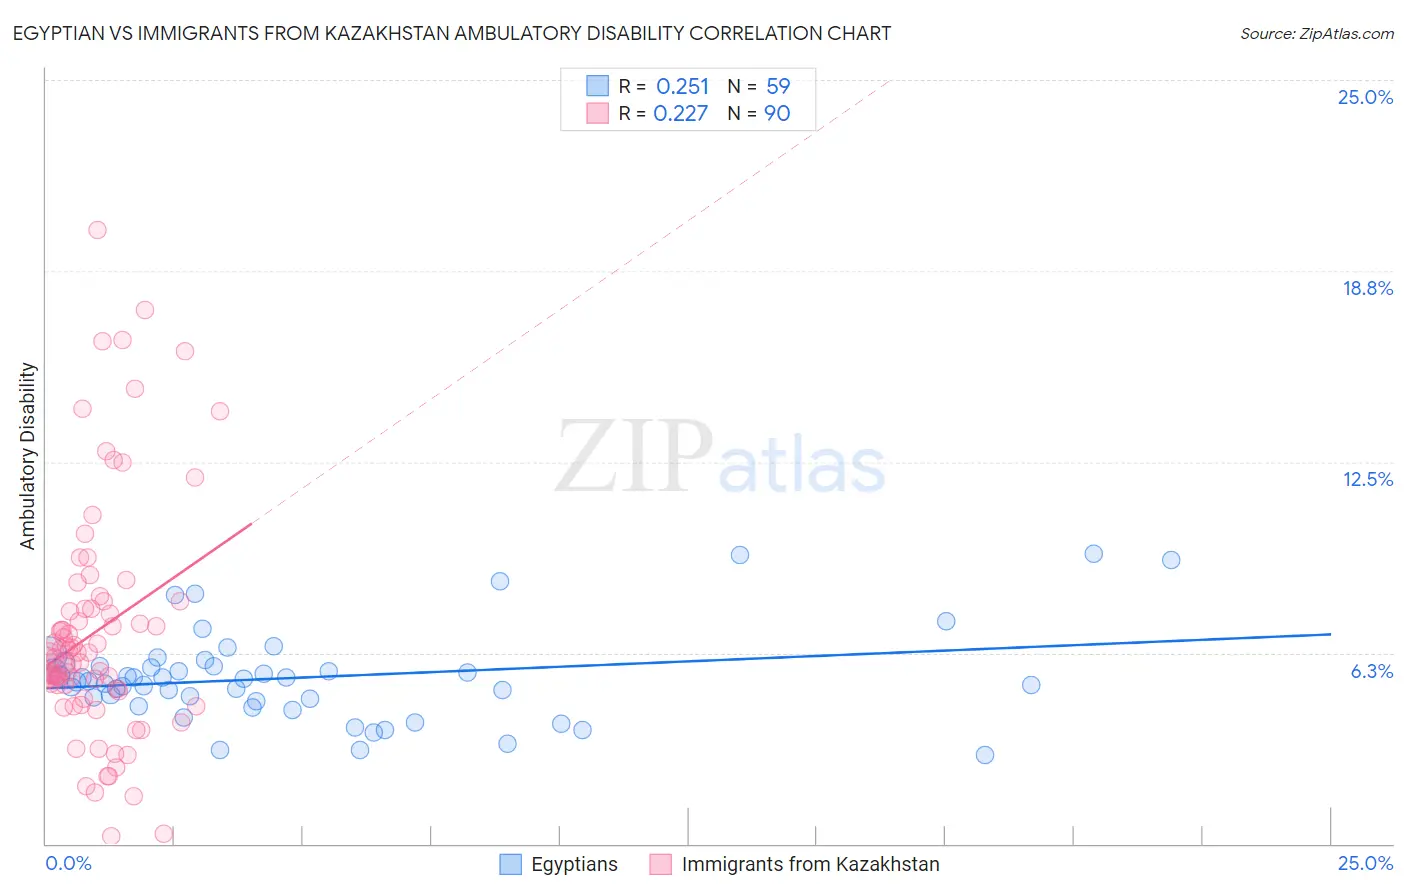
Egyptian vs Immigrants from Kazakhstan Ambulatory Disability Correlation Chart

The statistical analysis conducted on geographies consisting of 276,859,552 people shows a weak positive correlation between the proportion of Egyptians and percentage of population with ambulatory disability in the United States with a correlation coefficient (R) of 0.251 and weighted average of 5.6%. Similarly, the statistical analysis conducted on geographies consisting of 124,443,278 people shows a weak positive correlation between the proportion of Immigrants from Kazakhstan and percentage of population with ambulatory disability in the United States with a correlation coefficient (R) of 0.227 and weighted average of 5.9%, a difference of 6.9%.
Egyptian vs Immigrants from Kazakhstan Ambulatory Disability

Ambulatory Disability Correlation Summary

MeasurementEgyptianImmigrants from Kazakhstan
Minimum2.9%0.25%
Maximum9.5%20.1%
Range6.6%19.9%
Mean5.4%6.9%
Median5.3%6.2%
Interquartile 25% (IQ1)4.7%5.1%
Interquartile 75% (IQ3)5.8%7.7%
Interquartile Range (IQR)1.2%2.6%
Standard Deviation (Sample)1.5%3.8%
Standard Deviation (Population)1.5%3.8%

Similar Demographics by Ambulatory Disability

Demographics Similar to Egyptians by Ambulatory Disability

In terms of ambulatory disability, the demographic groups most similar to Egyptians are Immigrants from Japan (5.6%, a difference of 0.0%), Immigrants from Sweden (5.6%, a difference of 0.010%), Immigrants from Argentina (5.6%, a difference of 0.020%), Immigrants from Indonesia (5.5%, a difference of 0.18%), and Bulgarian (5.6%, a difference of 0.21%).
DemographicsRating | RankAmbulatory Disability
Immigrants | Eritrea
100.0
/100
|
#39
Exceptional
5.5%
Venezuelans
99.9
/100
|
#40
Exceptional
5.5%
Mongolians
99.9
/100
|
#41
Exceptional
5.5%
Argentineans
99.9
/100
|
#42
Exceptional
5.5%
Paraguayans
99.9
/100
|
#43
Exceptional
5.5%
Immigrants | Indonesia
99.9
/100
|
#44
Exceptional
5.5%
Immigrants | Sweden
99.9
/100
|
#45
Exceptional
5.6%
Egyptians
99.9
/100
|
#46
Exceptional
5.6%
Immigrants | Japan
99.9
/100
|
#47
Exceptional
5.6%
Immigrants | Argentina
99.9
/100
|
#48
Exceptional
5.6%
Bulgarians
99.9
/100
|
#49
Exceptional
5.6%
Luxembourgers
99.9
/100
|
#50
Exceptional
5.6%
Taiwanese
99.8
/100
|
#51
Exceptional
5.6%
Jordanians
99.8
/100
|
#52
Exceptional
5.6%
Immigrants | Egypt
99.8
/100
|
#53
Exceptional
5.6%

Demographics Similar to Immigrants from Kazakhstan by Ambulatory Disability

In terms of ambulatory disability, the demographic groups most similar to Immigrants from Kazakhstan are Immigrants from Costa Rica (5.9%, a difference of 0.030%), Immigrants from Norway (5.9%, a difference of 0.11%), Immigrants from Western Asia (5.9%, a difference of 0.14%), Immigrants from Nigeria (5.9%, a difference of 0.18%), and Immigrants from Europe (6.0%, a difference of 0.27%).
DemographicsRating | RankAmbulatory Disability
Immigrants | Russia
92.4
/100
|
#123
Exceptional
5.9%
Immigrants | Middle Africa
92.2
/100
|
#124
Exceptional
5.9%
Koreans
91.6
/100
|
#125
Exceptional
5.9%
Arabs
91.5
/100
|
#126
Exceptional
5.9%
Immigrants | Nigeria
90.9
/100
|
#127
Exceptional
5.9%
Immigrants | Western Asia
90.7
/100
|
#128
Exceptional
5.9%
Immigrants | Norway
90.5
/100
|
#129
Exceptional
5.9%
Immigrants | Kazakhstan
89.7
/100
|
#130
Excellent
5.9%
Immigrants | Costa Rica
89.5
/100
|
#131
Excellent
5.9%
Immigrants | Europe
87.8
/100
|
#132
Excellent
6.0%
Immigrants | Immigrants
86.9
/100
|
#133
Excellent
6.0%
Ute
86.6
/100
|
#134
Excellent
6.0%
Immigrants | Italy
85.0
/100
|
#135
Excellent
6.0%
Immigrants | North Macedonia
84.1
/100
|
#136
Excellent
6.0%
Immigrants | Syria
84.1
/100
|
#137
Excellent
6.0%