Sioux vs Immigrants from Kazakhstan Ambulatory Disability
COMPARE
Sioux
Immigrants from Kazakhstan
Ambulatory Disability
Ambulatory Disability Comparison
Sioux
Immigrants from Kazakhstan
6.7%
AMBULATORY DISABILITY
0.1/ 100
METRIC RATING
274th/ 347
METRIC RANK
5.9%
AMBULATORY DISABILITY
89.7/ 100
METRIC RATING
130th/ 347
METRIC RANK
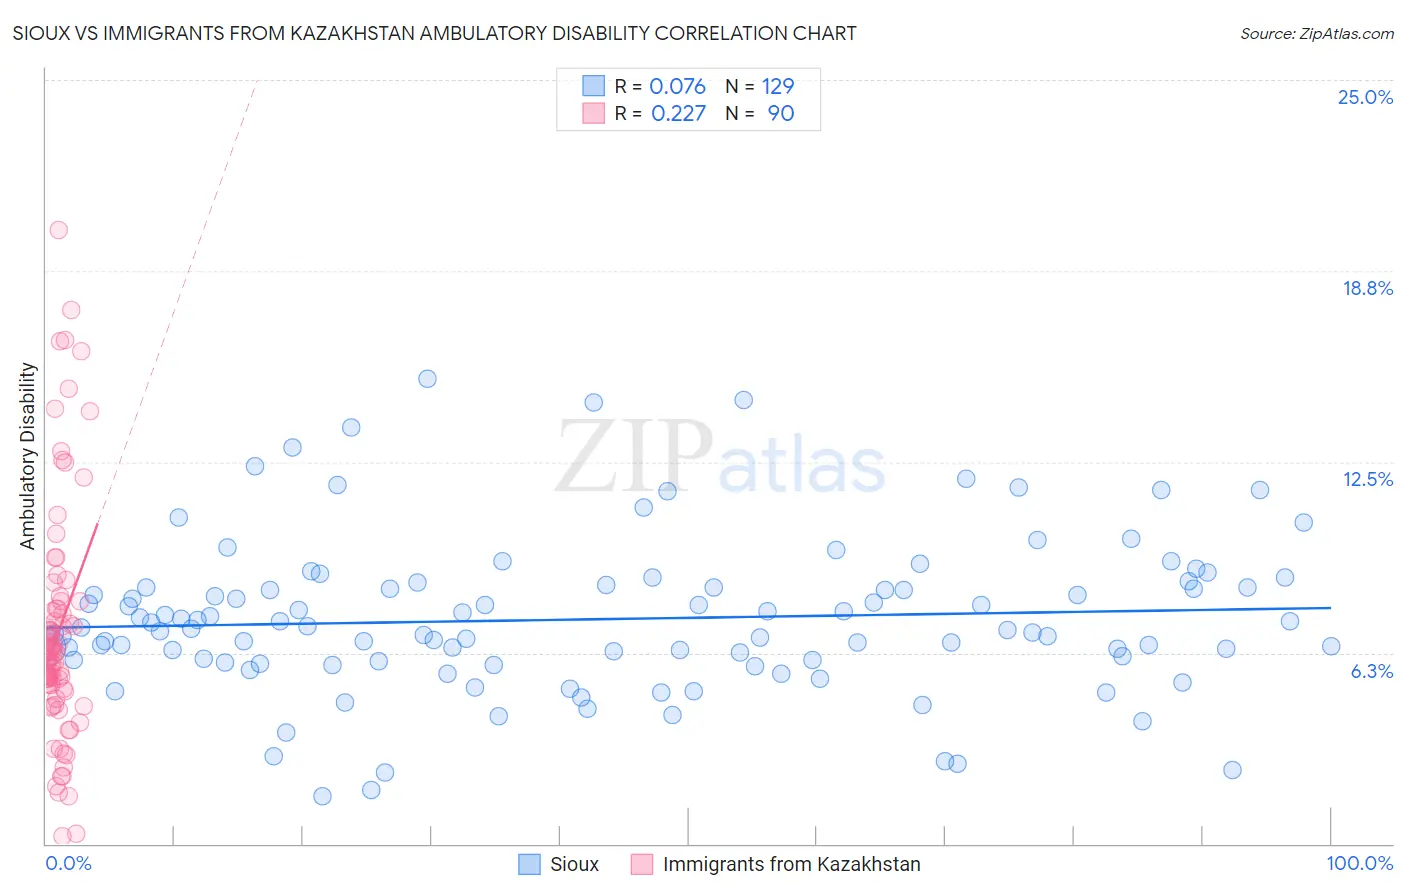
Sioux vs Immigrants from Kazakhstan Ambulatory Disability Correlation Chart
The statistical analysis conducted on geographies consisting of 234,119,186 people shows a slight positive correlation between the proportion of Sioux and percentage of population with ambulatory disability in the United States with a correlation coefficient (R) of 0.076 and weighted average of 6.7%. Similarly, the statistical analysis conducted on geographies consisting of 124,443,278 people shows a weak positive correlation between the proportion of Immigrants from Kazakhstan and percentage of population with ambulatory disability in the United States with a correlation coefficient (R) of 0.227 and weighted average of 5.9%, a difference of 12.9%.
Ambulatory Disability Correlation Summary
| Measurement | Sioux | Immigrants from Kazakhstan |
| Minimum | 1.5% | 0.25% |
| Maximum | 15.2% | 20.1% |
| Range | 13.7% | 19.9% |
| Mean | 7.3% | 6.9% |
| Median | 7.0% | 6.2% |
| Interquartile 25% (IQ1) | 6.0% | 5.1% |
| Interquartile 75% (IQ3) | 8.4% | 7.7% |
| Interquartile Range (IQR) | 2.4% | 2.6% |
| Standard Deviation (Sample) | 2.5% | 3.8% |
| Standard Deviation (Population) | 2.5% | 3.8% |
Similar Demographics by Ambulatory Disability
Demographics Similar to Sioux by Ambulatory Disability
In terms of ambulatory disability, the demographic groups most similar to Sioux are Immigrants from Guyana (6.7%, a difference of 0.060%), Celtic (6.7%, a difference of 0.090%), Jamaican (6.7%, a difference of 0.17%), White/Caucasian (6.7%, a difference of 0.24%), and Immigrants from West Indies (6.7%, a difference of 0.25%).
| Demographics | Rating | Rank | Ambulatory Disability |
| Trinidadians and Tobagonians | 0.2 /100 | #267 | Tragic 6.6% |
| Spanish | 0.2 /100 | #268 | Tragic 6.6% |
| French | 0.1 /100 | #269 | Tragic 6.6% |
| Slovaks | 0.1 /100 | #270 | Tragic 6.7% |
| Immigrants | Trinidad and Tobago | 0.1 /100 | #271 | Tragic 6.7% |
| French Canadians | 0.1 /100 | #272 | Tragic 6.7% |
| Whites/Caucasians | 0.1 /100 | #273 | Tragic 6.7% |
| Sioux | 0.1 /100 | #274 | Tragic 6.7% |
| Immigrants | Guyana | 0.1 /100 | #275 | Tragic 6.7% |
| Celtics | 0.1 /100 | #276 | Tragic 6.7% |
| Jamaicans | 0.1 /100 | #277 | Tragic 6.7% |
| Immigrants | West Indies | 0.1 /100 | #278 | Tragic 6.7% |
| Immigrants | Caribbean | 0.0 /100 | #279 | Tragic 6.7% |
| Pennsylvania Germans | 0.0 /100 | #280 | Tragic 6.8% |
| Yaqui | 0.0 /100 | #281 | Tragic 6.8% |
Demographics Similar to Immigrants from Kazakhstan by Ambulatory Disability
In terms of ambulatory disability, the demographic groups most similar to Immigrants from Kazakhstan are Immigrants from Costa Rica (5.9%, a difference of 0.030%), Immigrants from Norway (5.9%, a difference of 0.11%), Immigrants from Western Asia (5.9%, a difference of 0.14%), Immigrants from Nigeria (5.9%, a difference of 0.18%), and Immigrants from Europe (6.0%, a difference of 0.27%).
| Demographics | Rating | Rank | Ambulatory Disability |
| Immigrants | Russia | 92.4 /100 | #123 | Exceptional 5.9% |
| Immigrants | Middle Africa | 92.2 /100 | #124 | Exceptional 5.9% |
| Koreans | 91.6 /100 | #125 | Exceptional 5.9% |
| Arabs | 91.5 /100 | #126 | Exceptional 5.9% |
| Immigrants | Nigeria | 90.9 /100 | #127 | Exceptional 5.9% |
| Immigrants | Western Asia | 90.7 /100 | #128 | Exceptional 5.9% |
| Immigrants | Norway | 90.5 /100 | #129 | Exceptional 5.9% |
| Immigrants | Kazakhstan | 89.7 /100 | #130 | Excellent 5.9% |
| Immigrants | Costa Rica | 89.5 /100 | #131 | Excellent 5.9% |
| Immigrants | Europe | 87.8 /100 | #132 | Excellent 6.0% |
| Immigrants | Immigrants | 86.9 /100 | #133 | Excellent 6.0% |
| Ute | 86.6 /100 | #134 | Excellent 6.0% |
| Immigrants | Italy | 85.0 /100 | #135 | Excellent 6.0% |
| Immigrants | North Macedonia | 84.1 /100 | #136 | Excellent 6.0% |
| Immigrants | Syria | 84.1 /100 | #137 | Excellent 6.0% |