Crow vs Filipino Disability Age 35 to 64
COMPARE
Crow
Filipino
Disability Age 35 to 64
Disability Age 35 to 64 Comparison
Crow
Filipinos
14.6%
DISABILITY AGE 35 TO 64
0.0/ 100
METRIC RATING
317th/ 347
METRIC RANK
8.0%
DISABILITY AGE 35 TO 64
100.0/ 100
METRIC RATING
2nd/ 347
METRIC RANK
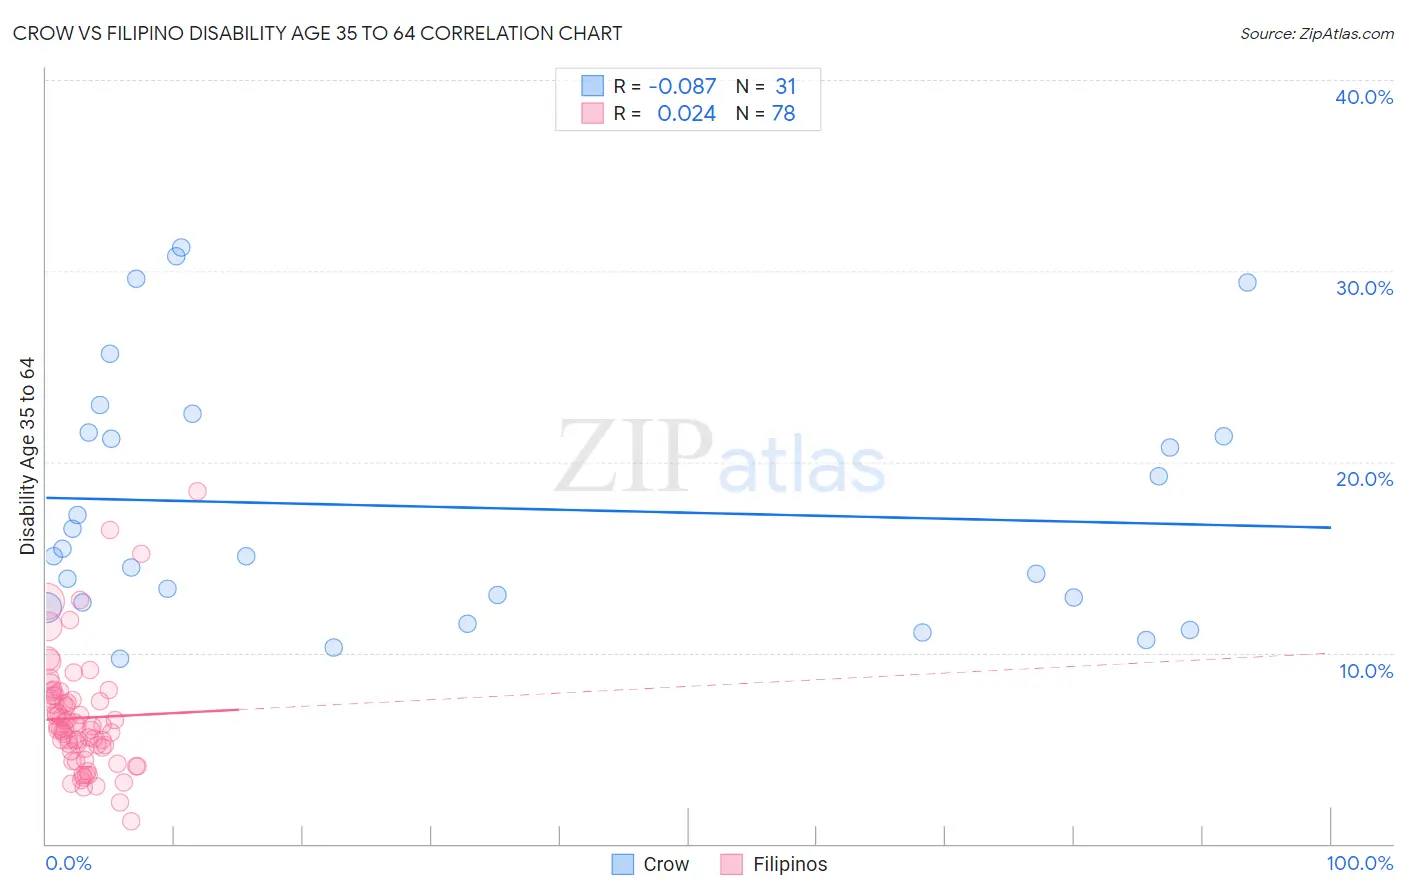
Crow vs Filipino Disability Age 35 to 64 Correlation Chart
The statistical analysis conducted on geographies consisting of 59,202,172 people shows a slight negative correlation between the proportion of Crow and percentage of population with a disability between the ages 34 and 64 in the United States with a correlation coefficient (R) of -0.087 and weighted average of 14.6%. Similarly, the statistical analysis conducted on geographies consisting of 254,159,243 people shows no correlation between the proportion of Filipinos and percentage of population with a disability between the ages 34 and 64 in the United States with a correlation coefficient (R) of 0.024 and weighted average of 8.0%, a difference of 81.6%.
Disability Age 35 to 64 Correlation Summary
| Measurement | Crow | Filipino |
| Minimum | 9.7% | 1.2% |
| Maximum | 31.2% | 18.4% |
| Range | 21.5% | 17.2% |
| Mean | 17.6% | 6.6% |
| Median | 15.1% | 6.1% |
| Interquartile 25% (IQ1) | 12.6% | 5.0% |
| Interquartile 75% (IQ3) | 21.5% | 7.6% |
| Interquartile Range (IQR) | 8.9% | 2.6% |
| Standard Deviation (Sample) | 6.5% | 3.0% |
| Standard Deviation (Population) | 6.4% | 3.0% |
Similar Demographics by Disability Age 35 to 64
Demographics Similar to Crow by Disability Age 35 to 64
In terms of disability age 35 to 64, the demographic groups most similar to Crow are Ottawa (14.6%, a difference of 0.070%), Immigrants from Cabo Verde (14.7%, a difference of 0.49%), Black/African American (14.7%, a difference of 0.64%), Osage (14.5%, a difference of 0.87%), and Comanche (14.7%, a difference of 0.90%).
| Demographics | Rating | Rank | Disability Age 35 to 64 |
| Cape Verdeans | 0.0 /100 | #310 | Tragic 14.1% |
| Immigrants | Azores | 0.0 /100 | #311 | Tragic 14.3% |
| Paiute | 0.0 /100 | #312 | Tragic 14.3% |
| Iroquois | 0.0 /100 | #313 | Tragic 14.4% |
| Shoshone | 0.0 /100 | #314 | Tragic 14.5% |
| Alaska Natives | 0.0 /100 | #315 | Tragic 14.5% |
| Osage | 0.0 /100 | #316 | Tragic 14.5% |
| Crow | 0.0 /100 | #317 | Tragic 14.6% |
| Ottawa | 0.0 /100 | #318 | Tragic 14.6% |
| Immigrants | Cabo Verde | 0.0 /100 | #319 | Tragic 14.7% |
| Blacks/African Americans | 0.0 /100 | #320 | Tragic 14.7% |
| Comanche | 0.0 /100 | #321 | Tragic 14.7% |
| Potawatomi | 0.0 /100 | #322 | Tragic 14.8% |
| Apache | 0.0 /100 | #323 | Tragic 14.9% |
| Chippewa | 0.0 /100 | #324 | Tragic 15.0% |
Demographics Similar to Filipinos by Disability Age 35 to 64
In terms of disability age 35 to 64, the demographic groups most similar to Filipinos are Immigrants from Hong Kong (8.2%, a difference of 1.8%), Immigrants from Taiwan (7.8%, a difference of 2.5%), Immigrants from India (8.3%, a difference of 2.9%), Immigrants from Iran (8.5%, a difference of 5.5%), and Thai (8.6%, a difference of 6.5%).
| Demographics | Rating | Rank | Disability Age 35 to 64 |
| Immigrants | Taiwan | 100.0 /100 | #1 | Exceptional 7.8% |
| Filipinos | 100.0 /100 | #2 | Exceptional 8.0% |
| Immigrants | Hong Kong | 100.0 /100 | #3 | Exceptional 8.2% |
| Immigrants | India | 100.0 /100 | #4 | Exceptional 8.3% |
| Immigrants | Iran | 100.0 /100 | #5 | Exceptional 8.5% |
| Thais | 100.0 /100 | #6 | Exceptional 8.6% |
| Immigrants | Israel | 100.0 /100 | #7 | Exceptional 8.6% |
| Iranians | 100.0 /100 | #8 | Exceptional 8.7% |
| Immigrants | China | 100.0 /100 | #9 | Exceptional 8.7% |
| Immigrants | Bolivia | 100.0 /100 | #10 | Exceptional 8.7% |
| Immigrants | Eastern Asia | 100.0 /100 | #11 | Exceptional 8.8% |
| Indians (Asian) | 100.0 /100 | #12 | Exceptional 8.9% |
| Immigrants | South Central Asia | 100.0 /100 | #13 | Exceptional 8.9% |
| Immigrants | Singapore | 100.0 /100 | #14 | Exceptional 8.9% |
| Bolivians | 100.0 /100 | #15 | Exceptional 8.9% |