Crow vs Immigrants from Australia Disability Age 35 to 64
COMPARE
Crow
Immigrants from Australia
Disability Age 35 to 64
Disability Age 35 to 64 Comparison
Crow
Immigrants from Australia
14.6%
DISABILITY AGE 35 TO 64
0.0/ 100
METRIC RATING
317th/ 347
METRIC RANK
9.7%
DISABILITY AGE 35 TO 64
99.9/ 100
METRIC RATING
34th/ 347
METRIC RANK
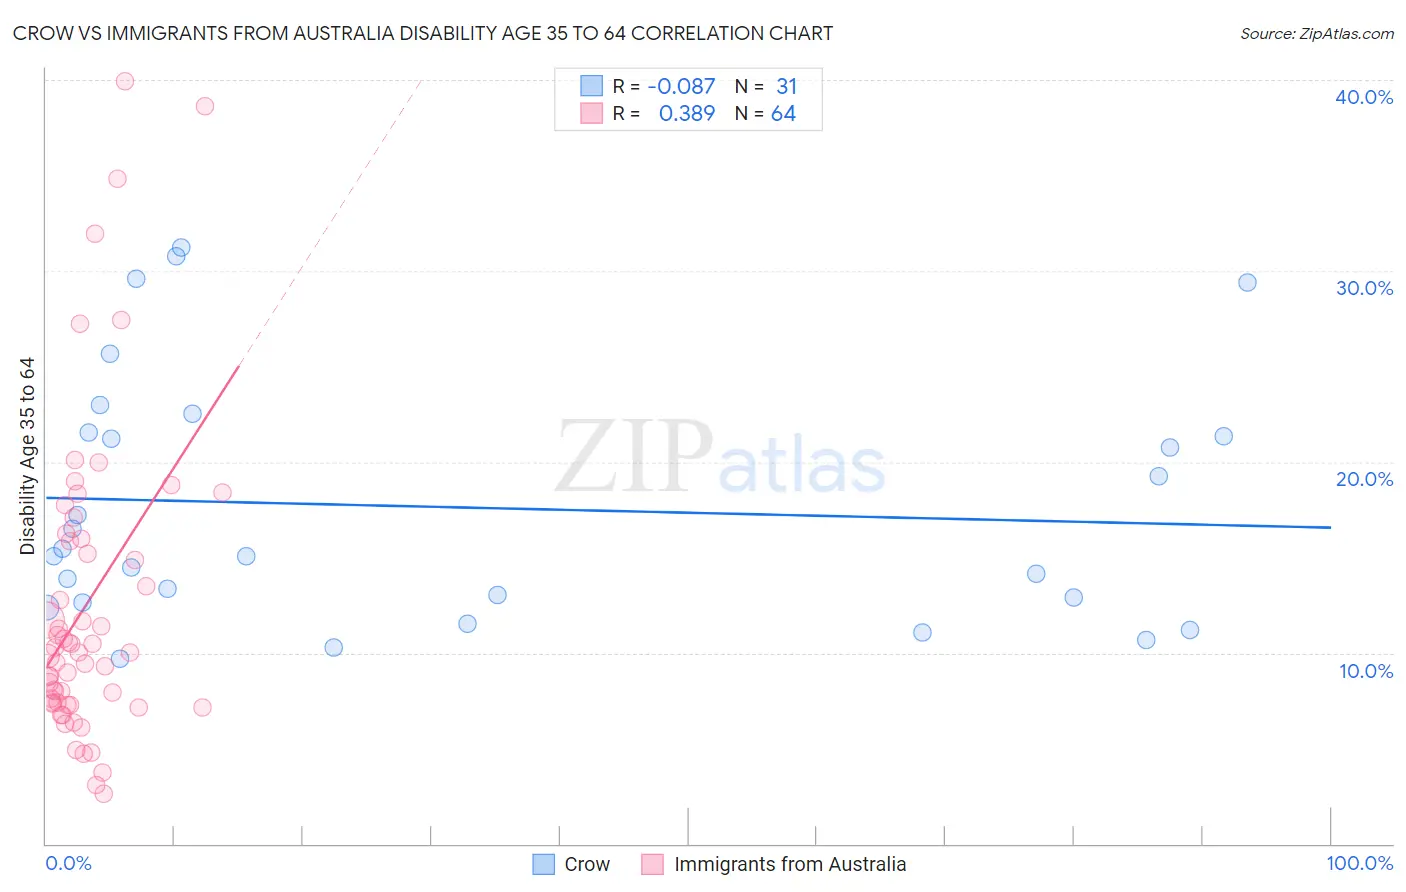
Crow vs Immigrants from Australia Disability Age 35 to 64 Correlation Chart
The statistical analysis conducted on geographies consisting of 59,202,172 people shows a slight negative correlation between the proportion of Crow and percentage of population with a disability between the ages 34 and 64 in the United States with a correlation coefficient (R) of -0.087 and weighted average of 14.6%. Similarly, the statistical analysis conducted on geographies consisting of 227,131,013 people shows a mild positive correlation between the proportion of Immigrants from Australia and percentage of population with a disability between the ages 34 and 64 in the United States with a correlation coefficient (R) of 0.389 and weighted average of 9.7%, a difference of 51.2%.
Disability Age 35 to 64 Correlation Summary
| Measurement | Crow | Immigrants from Australia |
| Minimum | 9.7% | 2.6% |
| Maximum | 31.2% | 40.0% |
| Range | 21.5% | 37.3% |
| Mean | 17.6% | 12.5% |
| Median | 15.1% | 10.0% |
| Interquartile 25% (IQ1) | 12.6% | 7.3% |
| Interquartile 75% (IQ3) | 21.5% | 15.9% |
| Interquartile Range (IQR) | 8.9% | 8.6% |
| Standard Deviation (Sample) | 6.5% | 8.1% |
| Standard Deviation (Population) | 6.4% | 8.1% |
Similar Demographics by Disability Age 35 to 64
Demographics Similar to Crow by Disability Age 35 to 64
In terms of disability age 35 to 64, the demographic groups most similar to Crow are Ottawa (14.6%, a difference of 0.070%), Immigrants from Cabo Verde (14.7%, a difference of 0.49%), Black/African American (14.7%, a difference of 0.64%), Osage (14.5%, a difference of 0.87%), and Comanche (14.7%, a difference of 0.90%).
| Demographics | Rating | Rank | Disability Age 35 to 64 |
| Cape Verdeans | 0.0 /100 | #310 | Tragic 14.1% |
| Immigrants | Azores | 0.0 /100 | #311 | Tragic 14.3% |
| Paiute | 0.0 /100 | #312 | Tragic 14.3% |
| Iroquois | 0.0 /100 | #313 | Tragic 14.4% |
| Shoshone | 0.0 /100 | #314 | Tragic 14.5% |
| Alaska Natives | 0.0 /100 | #315 | Tragic 14.5% |
| Osage | 0.0 /100 | #316 | Tragic 14.5% |
| Crow | 0.0 /100 | #317 | Tragic 14.6% |
| Ottawa | 0.0 /100 | #318 | Tragic 14.6% |
| Immigrants | Cabo Verde | 0.0 /100 | #319 | Tragic 14.7% |
| Blacks/African Americans | 0.0 /100 | #320 | Tragic 14.7% |
| Comanche | 0.0 /100 | #321 | Tragic 14.7% |
| Potawatomi | 0.0 /100 | #322 | Tragic 14.8% |
| Apache | 0.0 /100 | #323 | Tragic 14.9% |
| Chippewa | 0.0 /100 | #324 | Tragic 15.0% |
Demographics Similar to Immigrants from Australia by Disability Age 35 to 64
In terms of disability age 35 to 64, the demographic groups most similar to Immigrants from Australia are Immigrants from Indonesia (9.7%, a difference of 0.070%), Bulgarian (9.7%, a difference of 0.10%), Immigrants from Cuba (9.7%, a difference of 0.14%), Turkish (9.7%, a difference of 0.15%), and Immigrants from Turkey (9.7%, a difference of 0.22%).
| Demographics | Rating | Rank | Disability Age 35 to 64 |
| Immigrants | Asia | 100.0 /100 | #27 | Exceptional 9.5% |
| Immigrants | Pakistan | 100.0 /100 | #28 | Exceptional 9.5% |
| Immigrants | Ireland | 100.0 /100 | #29 | Exceptional 9.5% |
| Immigrants | Japan | 100.0 /100 | #30 | Exceptional 9.5% |
| Immigrants | Lithuania | 99.9 /100 | #31 | Exceptional 9.6% |
| Turks | 99.9 /100 | #32 | Exceptional 9.7% |
| Immigrants | Indonesia | 99.9 /100 | #33 | Exceptional 9.7% |
| Immigrants | Australia | 99.9 /100 | #34 | Exceptional 9.7% |
| Bulgarians | 99.9 /100 | #35 | Exceptional 9.7% |
| Immigrants | Cuba | 99.9 /100 | #36 | Exceptional 9.7% |
| Immigrants | Turkey | 99.9 /100 | #37 | Exceptional 9.7% |
| Egyptians | 99.9 /100 | #38 | Exceptional 9.7% |
| Immigrants | Belarus | 99.9 /100 | #39 | Exceptional 9.7% |
| Immigrants | Armenia | 99.9 /100 | #40 | Exceptional 9.7% |
| Israelis | 99.9 /100 | #41 | Exceptional 9.7% |