Croatian vs Cape Verdean Disability
COMPARE
Croatian
Cape Verdean
Disability
Disability Comparison
Croatians
Cape Verdeans
12.1%
DISABILITY
4.9/ 100
METRIC RATING
219th/ 347
METRIC RANK
13.5%
DISABILITY
0.0/ 100
METRIC RATING
306th/ 347
METRIC RANK
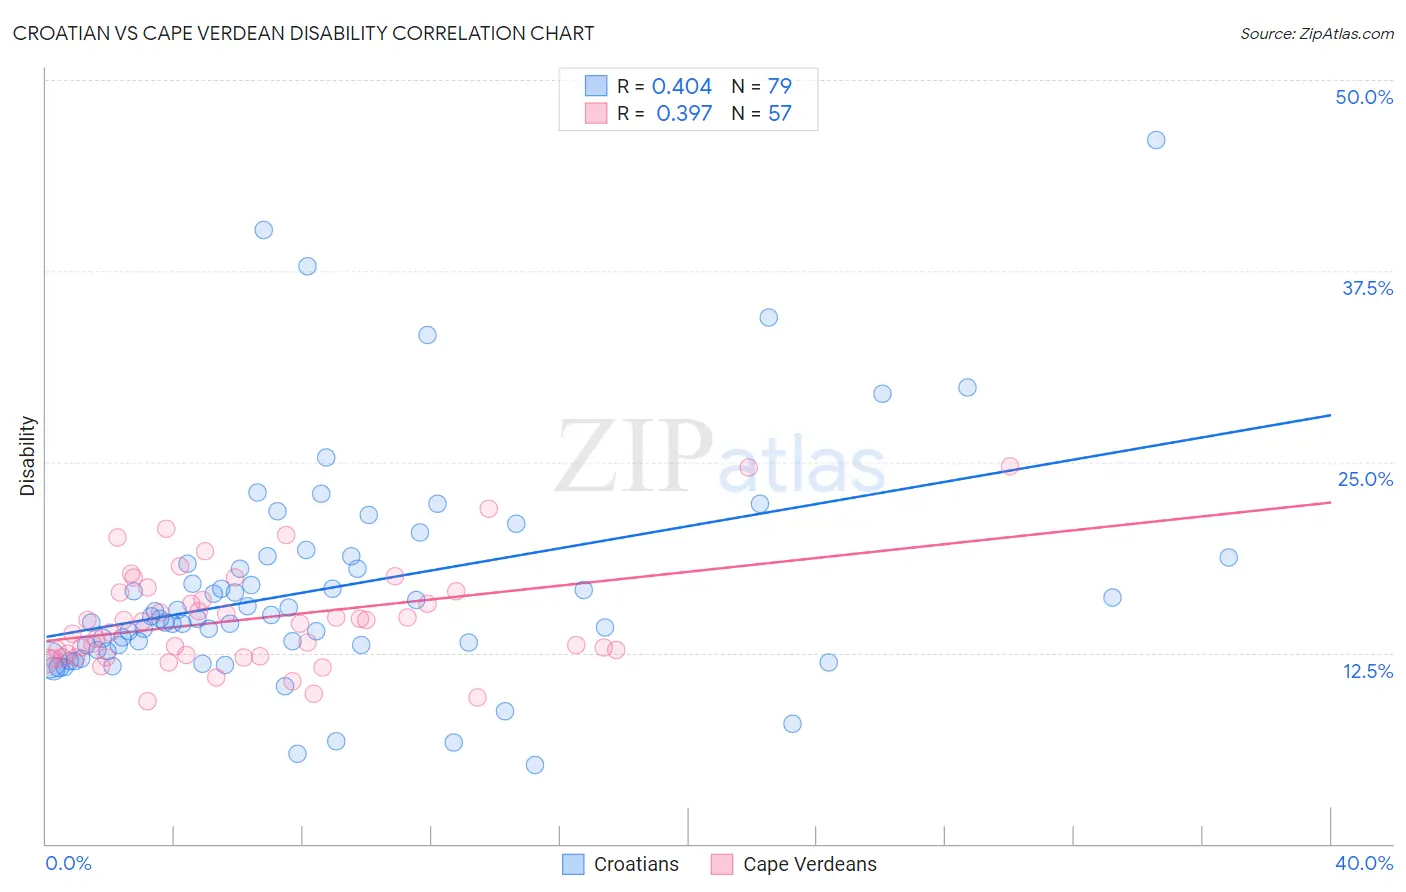
Croatian vs Cape Verdean Disability Correlation Chart
The statistical analysis conducted on geographies consisting of 375,710,969 people shows a moderate positive correlation between the proportion of Croatians and percentage of population with a disability in the United States with a correlation coefficient (R) of 0.404 and weighted average of 12.1%. Similarly, the statistical analysis conducted on geographies consisting of 107,573,874 people shows a mild positive correlation between the proportion of Cape Verdeans and percentage of population with a disability in the United States with a correlation coefficient (R) of 0.397 and weighted average of 13.5%, a difference of 11.8%.
Disability Correlation Summary
| Measurement | Croatian | Cape Verdean |
| Minimum | 5.2% | 9.3% |
| Maximum | 46.0% | 24.7% |
| Range | 40.9% | 15.4% |
| Mean | 16.7% | 14.7% |
| Median | 14.7% | 14.4% |
| Interquartile 25% (IQ1) | 12.7% | 12.3% |
| Interquartile 75% (IQ3) | 18.8% | 16.5% |
| Interquartile Range (IQR) | 6.1% | 4.2% |
| Standard Deviation (Sample) | 7.4% | 3.4% |
| Standard Deviation (Population) | 7.3% | 3.4% |
Similar Demographics by Disability
Demographics Similar to Croatians by Disability
In terms of disability, the demographic groups most similar to Croatians are Immigrants from Jamaica (12.1%, a difference of 0.040%), Immigrants from Bahamas (12.1%, a difference of 0.040%), Panamanian (12.1%, a difference of 0.11%), Immigrants from North America (12.1%, a difference of 0.11%), and Northern European (12.1%, a difference of 0.16%).
| Demographics | Rating | Rank | Disability |
| Austrians | 7.2 /100 | #212 | Tragic 12.0% |
| Immigrants | Iraq | 7.1 /100 | #213 | Tragic 12.0% |
| Immigrants | Somalia | 6.8 /100 | #214 | Tragic 12.0% |
| Immigrants | Canada | 6.1 /100 | #215 | Tragic 12.1% |
| Panamanians | 5.4 /100 | #216 | Tragic 12.1% |
| Immigrants | North America | 5.3 /100 | #217 | Tragic 12.1% |
| Immigrants | Jamaica | 5.0 /100 | #218 | Tragic 12.1% |
| Croatians | 4.9 /100 | #219 | Tragic 12.1% |
| Immigrants | Bahamas | 4.7 /100 | #220 | Tragic 12.1% |
| Northern Europeans | 4.2 /100 | #221 | Tragic 12.1% |
| Spanish American Indians | 4.1 /100 | #222 | Tragic 12.1% |
| Hispanics or Latinos | 3.9 /100 | #223 | Tragic 12.1% |
| Mexicans | 3.7 /100 | #224 | Tragic 12.1% |
| Senegalese | 3.5 /100 | #225 | Tragic 12.1% |
| Jamaicans | 3.3 /100 | #226 | Tragic 12.1% |
Demographics Similar to Cape Verdeans by Disability
In terms of disability, the demographic groups most similar to Cape Verdeans are Shoshone (13.5%, a difference of 0.050%), French American Indian (13.5%, a difference of 0.14%), Tlingit-Haida (13.5%, a difference of 0.23%), French Canadian (13.4%, a difference of 0.61%), and Blackfeet (13.6%, a difference of 0.76%).
| Demographics | Rating | Rank | Disability |
| French | 0.0 /100 | #299 | Tragic 13.2% |
| Pennsylvania Germans | 0.0 /100 | #300 | Tragic 13.2% |
| Immigrants | Micronesia | 0.0 /100 | #301 | Tragic 13.2% |
| Arapaho | 0.0 /100 | #302 | Tragic 13.2% |
| Scotch-Irish | 0.0 /100 | #303 | Tragic 13.3% |
| Yakama | 0.0 /100 | #304 | Tragic 13.4% |
| French Canadians | 0.0 /100 | #305 | Tragic 13.4% |
| Cape Verdeans | 0.0 /100 | #306 | Tragic 13.5% |
| Shoshone | 0.0 /100 | #307 | Tragic 13.5% |
| French American Indians | 0.0 /100 | #308 | Tragic 13.5% |
| Tlingit-Haida | 0.0 /100 | #309 | Tragic 13.5% |
| Blackfeet | 0.0 /100 | #310 | Tragic 13.6% |
| Delaware | 0.0 /100 | #311 | Tragic 13.6% |
| Spanish Americans | 0.0 /100 | #312 | Tragic 13.6% |
| Cree | 0.0 /100 | #313 | Tragic 13.7% |