Croatian vs Tongan Disability
COMPARE
Croatian
Tongan
Disability
Disability Comparison
Croatians
Tongans
12.1%
DISABILITY
4.9/ 100
METRIC RATING
219th/ 347
METRIC RANK
10.8%
DISABILITY
99.9/ 100
METRIC RATING
46th/ 347
METRIC RANK
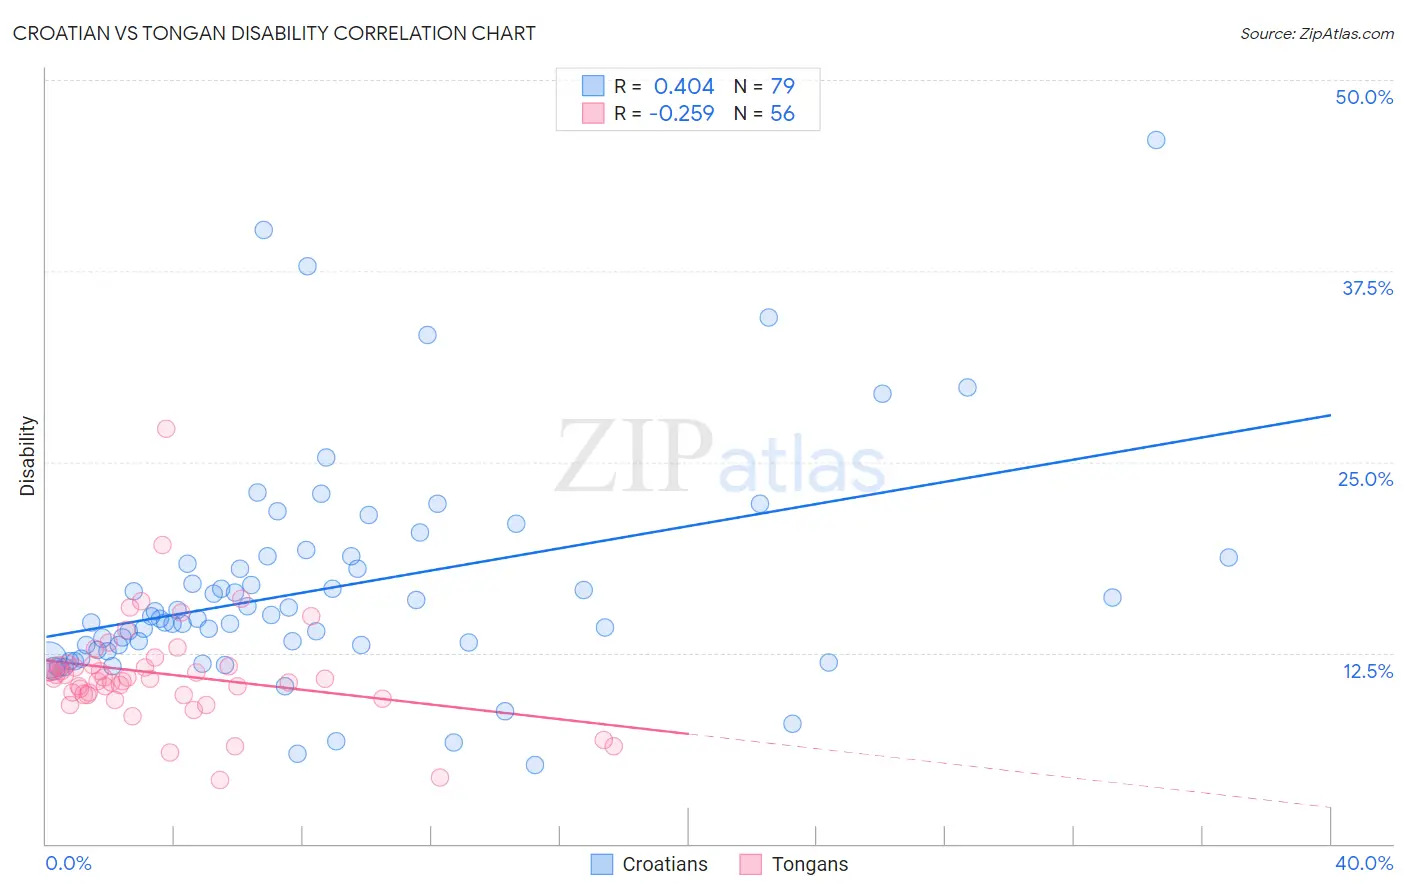
Croatian vs Tongan Disability Correlation Chart
The statistical analysis conducted on geographies consisting of 375,710,969 people shows a moderate positive correlation between the proportion of Croatians and percentage of population with a disability in the United States with a correlation coefficient (R) of 0.404 and weighted average of 12.1%. Similarly, the statistical analysis conducted on geographies consisting of 102,894,634 people shows a weak negative correlation between the proportion of Tongans and percentage of population with a disability in the United States with a correlation coefficient (R) of -0.259 and weighted average of 10.8%, a difference of 11.6%.
Disability Correlation Summary
| Measurement | Croatian | Tongan |
| Minimum | 5.2% | 4.2% |
| Maximum | 46.0% | 27.1% |
| Range | 40.9% | 23.0% |
| Mean | 16.7% | 11.1% |
| Median | 14.7% | 10.8% |
| Interquartile 25% (IQ1) | 12.7% | 9.8% |
| Interquartile 75% (IQ3) | 18.8% | 11.7% |
| Interquartile Range (IQR) | 6.1% | 1.9% |
| Standard Deviation (Sample) | 7.4% | 3.5% |
| Standard Deviation (Population) | 7.3% | 3.5% |
Similar Demographics by Disability
Demographics Similar to Croatians by Disability
In terms of disability, the demographic groups most similar to Croatians are Immigrants from Jamaica (12.1%, a difference of 0.040%), Immigrants from Bahamas (12.1%, a difference of 0.040%), Panamanian (12.1%, a difference of 0.11%), Immigrants from North America (12.1%, a difference of 0.11%), and Northern European (12.1%, a difference of 0.16%).
| Demographics | Rating | Rank | Disability |
| Austrians | 7.2 /100 | #212 | Tragic 12.0% |
| Immigrants | Iraq | 7.1 /100 | #213 | Tragic 12.0% |
| Immigrants | Somalia | 6.8 /100 | #214 | Tragic 12.0% |
| Immigrants | Canada | 6.1 /100 | #215 | Tragic 12.1% |
| Panamanians | 5.4 /100 | #216 | Tragic 12.1% |
| Immigrants | North America | 5.3 /100 | #217 | Tragic 12.1% |
| Immigrants | Jamaica | 5.0 /100 | #218 | Tragic 12.1% |
| Croatians | 4.9 /100 | #219 | Tragic 12.1% |
| Immigrants | Bahamas | 4.7 /100 | #220 | Tragic 12.1% |
| Northern Europeans | 4.2 /100 | #221 | Tragic 12.1% |
| Spanish American Indians | 4.1 /100 | #222 | Tragic 12.1% |
| Hispanics or Latinos | 3.9 /100 | #223 | Tragic 12.1% |
| Mexicans | 3.7 /100 | #224 | Tragic 12.1% |
| Senegalese | 3.5 /100 | #225 | Tragic 12.1% |
| Jamaicans | 3.3 /100 | #226 | Tragic 12.1% |
Demographics Similar to Tongans by Disability
In terms of disability, the demographic groups most similar to Tongans are Immigrants from Peru (10.8%, a difference of 0.010%), Taiwanese (10.8%, a difference of 0.010%), Soviet Union (10.9%, a difference of 0.20%), Vietnamese (10.9%, a difference of 0.26%), and Immigrants from Saudi Arabia (10.9%, a difference of 0.26%).
| Demographics | Rating | Rank | Disability |
| Cambodians | 99.9 /100 | #39 | Exceptional 10.8% |
| Mongolians | 99.9 /100 | #40 | Exceptional 10.8% |
| Immigrants | Australia | 99.9 /100 | #41 | Exceptional 10.8% |
| Immigrants | Nepal | 99.9 /100 | #42 | Exceptional 10.8% |
| Israelis | 99.9 /100 | #43 | Exceptional 10.8% |
| Immigrants | Japan | 99.9 /100 | #44 | Exceptional 10.8% |
| Immigrants | Peru | 99.9 /100 | #45 | Exceptional 10.8% |
| Tongans | 99.9 /100 | #46 | Exceptional 10.8% |
| Taiwanese | 99.9 /100 | #47 | Exceptional 10.8% |
| Soviet Union | 99.9 /100 | #48 | Exceptional 10.9% |
| Vietnamese | 99.9 /100 | #49 | Exceptional 10.9% |
| Immigrants | Saudi Arabia | 99.9 /100 | #50 | Exceptional 10.9% |
| Peruvians | 99.8 /100 | #51 | Exceptional 10.9% |
| South Americans | 99.8 /100 | #52 | Exceptional 10.9% |
| Immigrants | Spain | 99.8 /100 | #53 | Exceptional 10.9% |