Croatian vs Immigrants from Ghana Unemployment
COMPARE
Croatian
Immigrants from Ghana
Unemployment
Unemployment Comparison
Croatians
Immigrants from Ghana
4.8%
UNEMPLOYMENT
99.8/ 100
METRIC RATING
31st/ 347
METRIC RANK
6.1%
UNEMPLOYMENT
0.0/ 100
METRIC RATING
283rd/ 347
METRIC RANK
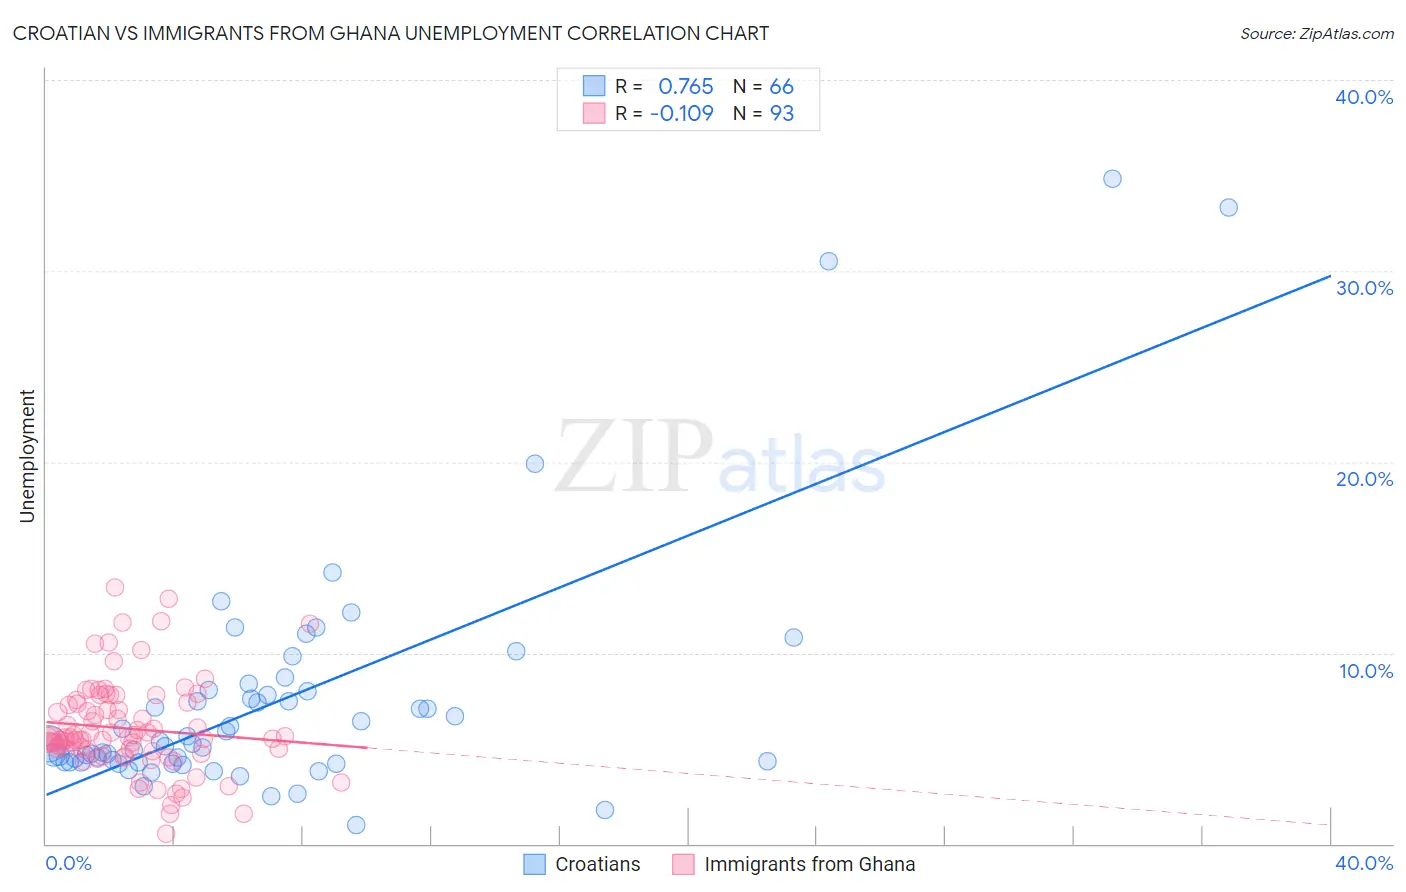
Croatian vs Immigrants from Ghana Unemployment Correlation Chart
The statistical analysis conducted on geographies consisting of 375,237,287 people shows a strong positive correlation between the proportion of Croatians and unemployment in the United States with a correlation coefficient (R) of 0.765 and weighted average of 4.8%. Similarly, the statistical analysis conducted on geographies consisting of 199,867,577 people shows a poor negative correlation between the proportion of Immigrants from Ghana and unemployment in the United States with a correlation coefficient (R) of -0.109 and weighted average of 6.1%, a difference of 27.5%.
Unemployment Correlation Summary
| Measurement | Croatian | Immigrants from Ghana |
| Minimum | 1.0% | 0.50% |
| Maximum | 34.8% | 13.4% |
| Range | 33.8% | 12.9% |
| Mean | 7.5% | 6.0% |
| Median | 5.2% | 5.6% |
| Interquartile 25% (IQ1) | 4.3% | 4.9% |
| Interquartile 75% (IQ3) | 8.0% | 7.4% |
| Interquartile Range (IQR) | 3.7% | 2.5% |
| Standard Deviation (Sample) | 6.4% | 2.4% |
| Standard Deviation (Population) | 6.4% | 2.4% |
Similar Demographics by Unemployment
Demographics Similar to Croatians by Unemployment
In terms of unemployment, the demographic groups most similar to Croatians are Irish (4.8%, a difference of 0.020%), Zimbabwean (4.8%, a difference of 0.10%), Sudanese (4.8%, a difference of 0.11%), Immigrants from Bolivia (4.8%, a difference of 0.15%), and Scotch-Irish (4.8%, a difference of 0.22%).
| Demographics | Rating | Rank | Unemployment |
| Venezuelans | 99.9 /100 | #24 | Exceptional 4.7% |
| Latvians | 99.9 /100 | #25 | Exceptional 4.7% |
| Bulgarians | 99.9 /100 | #26 | Exceptional 4.7% |
| Finns | 99.9 /100 | #27 | Exceptional 4.7% |
| Cubans | 99.8 /100 | #28 | Exceptional 4.7% |
| Poles | 99.8 /100 | #29 | Exceptional 4.7% |
| Irish | 99.8 /100 | #30 | Exceptional 4.8% |
| Croatians | 99.8 /100 | #31 | Exceptional 4.8% |
| Zimbabweans | 99.8 /100 | #32 | Exceptional 4.8% |
| Sudanese | 99.8 /100 | #33 | Exceptional 4.8% |
| Immigrants | Bolivia | 99.8 /100 | #34 | Exceptional 4.8% |
| Scotch-Irish | 99.8 /100 | #35 | Exceptional 4.8% |
| Tongans | 99.7 /100 | #36 | Exceptional 4.8% |
| Czechoslovakians | 99.7 /100 | #37 | Exceptional 4.8% |
| Bolivians | 99.7 /100 | #38 | Exceptional 4.8% |
Demographics Similar to Immigrants from Ghana by Unemployment
In terms of unemployment, the demographic groups most similar to Immigrants from Ghana are Immigrants from the Azores (6.1%, a difference of 0.080%), Aleut (6.1%, a difference of 0.13%), African (6.1%, a difference of 0.15%), Immigrants from Mexico (6.0%, a difference of 0.73%), and Immigrants from Western Africa (6.0%, a difference of 0.73%).
| Demographics | Rating | Rank | Unemployment |
| Immigrants | Central America | 0.0 /100 | #276 | Tragic 6.0% |
| Armenians | 0.0 /100 | #277 | Tragic 6.0% |
| Ghanaians | 0.0 /100 | #278 | Tragic 6.0% |
| Immigrants | Mexico | 0.0 /100 | #279 | Tragic 6.0% |
| Immigrants | Western Africa | 0.0 /100 | #280 | Tragic 6.0% |
| Africans | 0.0 /100 | #281 | Tragic 6.1% |
| Immigrants | Azores | 0.0 /100 | #282 | Tragic 6.1% |
| Immigrants | Ghana | 0.0 /100 | #283 | Tragic 6.1% |
| Aleuts | 0.0 /100 | #284 | Tragic 6.1% |
| Immigrants | Senegal | 0.0 /100 | #285 | Tragic 6.1% |
| Immigrants | Caribbean | 0.0 /100 | #286 | Tragic 6.2% |
| Nepalese | 0.0 /100 | #287 | Tragic 6.2% |
| Ecuadorians | 0.0 /100 | #288 | Tragic 6.2% |
| Chippewa | 0.0 /100 | #289 | Tragic 6.2% |
| Senegalese | 0.0 /100 | #290 | Tragic 6.2% |