Croatian vs Immigrants from France Disability
COMPARE
Croatian
Immigrants from France
Disability
Disability Comparison
Croatians
Immigrants from France
12.1%
DISABILITY
4.9/ 100
METRIC RATING
219th/ 347
METRIC RANK
11.0%
DISABILITY
99.4/ 100
METRIC RATING
70th/ 347
METRIC RANK
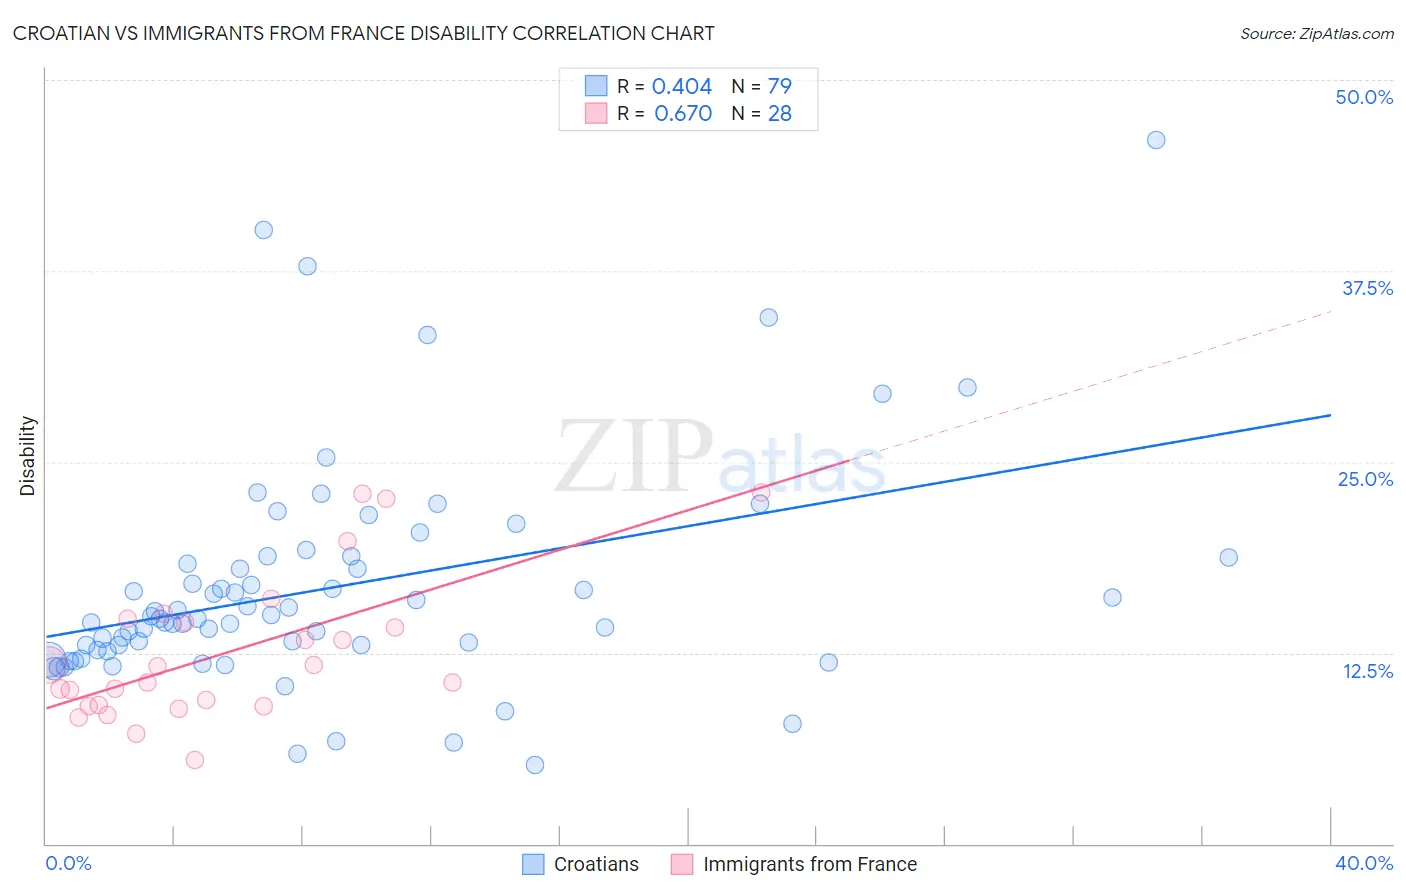
Croatian vs Immigrants from France Disability Correlation Chart
The statistical analysis conducted on geographies consisting of 375,710,969 people shows a moderate positive correlation between the proportion of Croatians and percentage of population with a disability in the United States with a correlation coefficient (R) of 0.404 and weighted average of 12.1%. Similarly, the statistical analysis conducted on geographies consisting of 287,909,175 people shows a significant positive correlation between the proportion of Immigrants from France and percentage of population with a disability in the United States with a correlation coefficient (R) of 0.670 and weighted average of 11.0%, a difference of 9.6%.
Disability Correlation Summary
| Measurement | Croatian | Immigrants from France |
| Minimum | 5.2% | 5.5% |
| Maximum | 46.0% | 23.0% |
| Range | 40.9% | 17.5% |
| Mean | 16.7% | 12.5% |
| Median | 14.7% | 11.1% |
| Interquartile 25% (IQ1) | 12.7% | 9.0% |
| Interquartile 75% (IQ3) | 18.8% | 14.6% |
| Interquartile Range (IQR) | 6.1% | 5.6% |
| Standard Deviation (Sample) | 7.4% | 4.7% |
| Standard Deviation (Population) | 7.3% | 4.6% |
Similar Demographics by Disability
Demographics Similar to Croatians by Disability
In terms of disability, the demographic groups most similar to Croatians are Immigrants from Jamaica (12.1%, a difference of 0.040%), Immigrants from Bahamas (12.1%, a difference of 0.040%), Panamanian (12.1%, a difference of 0.11%), Immigrants from North America (12.1%, a difference of 0.11%), and Northern European (12.1%, a difference of 0.16%).
| Demographics | Rating | Rank | Disability |
| Austrians | 7.2 /100 | #212 | Tragic 12.0% |
| Immigrants | Iraq | 7.1 /100 | #213 | Tragic 12.0% |
| Immigrants | Somalia | 6.8 /100 | #214 | Tragic 12.0% |
| Immigrants | Canada | 6.1 /100 | #215 | Tragic 12.1% |
| Panamanians | 5.4 /100 | #216 | Tragic 12.1% |
| Immigrants | North America | 5.3 /100 | #217 | Tragic 12.1% |
| Immigrants | Jamaica | 5.0 /100 | #218 | Tragic 12.1% |
| Croatians | 4.9 /100 | #219 | Tragic 12.1% |
| Immigrants | Bahamas | 4.7 /100 | #220 | Tragic 12.1% |
| Northern Europeans | 4.2 /100 | #221 | Tragic 12.1% |
| Spanish American Indians | 4.1 /100 | #222 | Tragic 12.1% |
| Hispanics or Latinos | 3.9 /100 | #223 | Tragic 12.1% |
| Mexicans | 3.7 /100 | #224 | Tragic 12.1% |
| Senegalese | 3.5 /100 | #225 | Tragic 12.1% |
| Jamaicans | 3.3 /100 | #226 | Tragic 12.1% |
Demographics Similar to Immigrants from France by Disability
In terms of disability, the demographic groups most similar to Immigrants from France are Immigrants from Lebanon (11.0%, a difference of 0.020%), Sri Lankan (11.0%, a difference of 0.080%), Immigrants from Chile (11.0%, a difference of 0.10%), Immigrants from Bangladesh (11.0%, a difference of 0.13%), and Immigrants from Serbia (11.0%, a difference of 0.15%).
| Demographics | Rating | Rank | Disability |
| Immigrants | Eritrea | 99.7 /100 | #63 | Exceptional 11.0% |
| Immigrants | Sweden | 99.6 /100 | #64 | Exceptional 11.0% |
| Bulgarians | 99.6 /100 | #65 | Exceptional 11.0% |
| Laotians | 99.6 /100 | #66 | Exceptional 11.0% |
| Colombians | 99.6 /100 | #67 | Exceptional 11.0% |
| Immigrants | Afghanistan | 99.6 /100 | #68 | Exceptional 11.0% |
| Sri Lankans | 99.5 /100 | #69 | Exceptional 11.0% |
| Immigrants | France | 99.4 /100 | #70 | Exceptional 11.0% |
| Immigrants | Lebanon | 99.4 /100 | #71 | Exceptional 11.0% |
| Immigrants | Chile | 99.4 /100 | #72 | Exceptional 11.0% |
| Immigrants | Bangladesh | 99.4 /100 | #73 | Exceptional 11.0% |
| Immigrants | Serbia | 99.4 /100 | #74 | Exceptional 11.0% |
| Immigrants | Vietnam | 99.4 /100 | #75 | Exceptional 11.0% |
| Sierra Leoneans | 99.3 /100 | #76 | Exceptional 11.0% |
| Immigrants | Belgium | 99.3 /100 | #77 | Exceptional 11.0% |