Croatian vs Tsimshian Disability
COMPARE
Croatian
Tsimshian
Disability
Disability Comparison
Croatians
Tsimshian
12.1%
DISABILITY
4.9/ 100
METRIC RATING
219th/ 347
METRIC RANK
16.1%
DISABILITY
0.0/ 100
METRIC RATING
346th/ 347
METRIC RANK
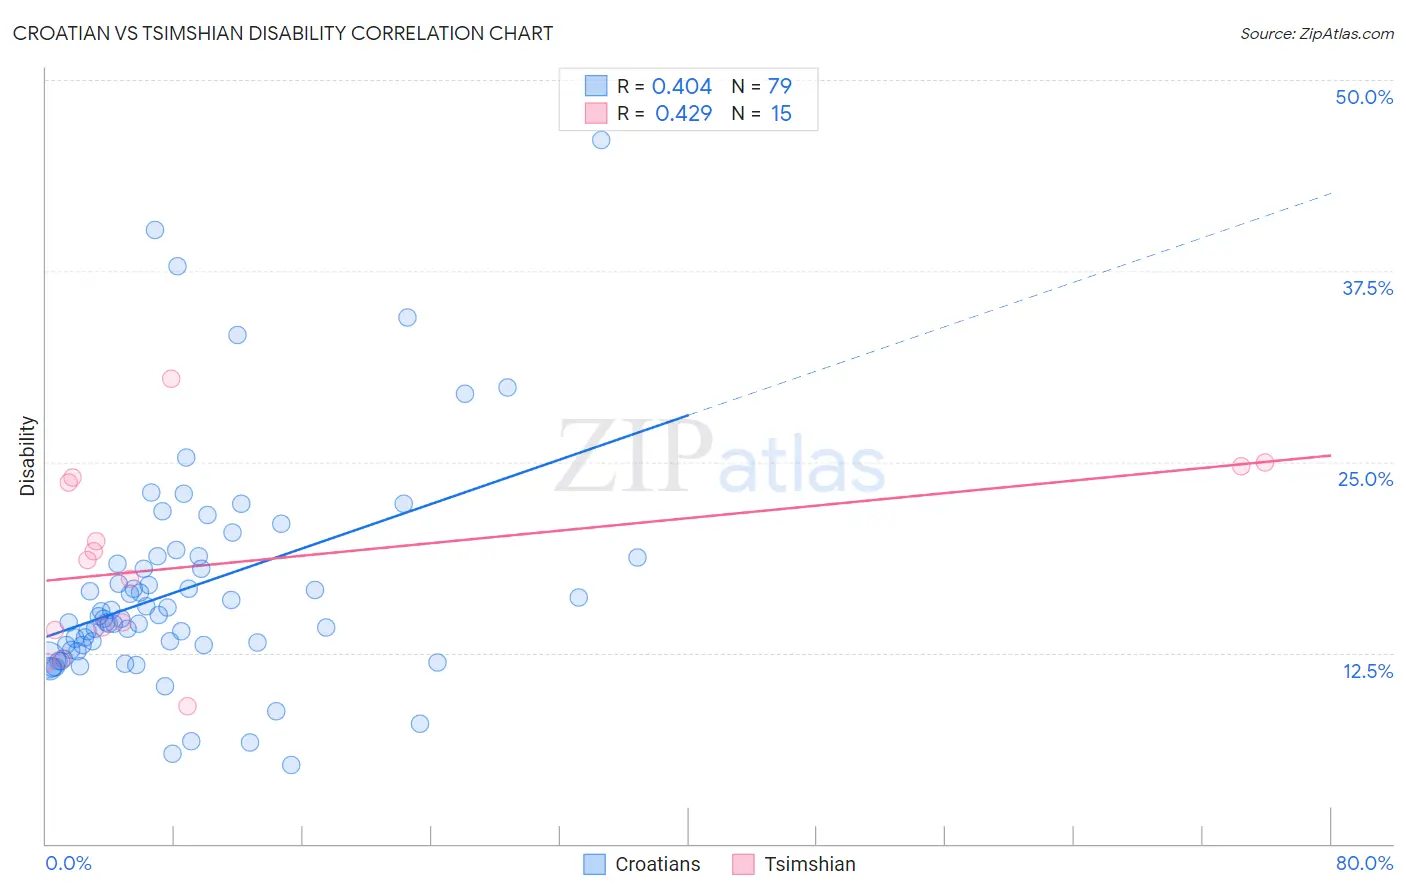
Croatian vs Tsimshian Disability Correlation Chart
The statistical analysis conducted on geographies consisting of 375,710,969 people shows a moderate positive correlation between the proportion of Croatians and percentage of population with a disability in the United States with a correlation coefficient (R) of 0.404 and weighted average of 12.1%. Similarly, the statistical analysis conducted on geographies consisting of 15,626,544 people shows a moderate positive correlation between the proportion of Tsimshian and percentage of population with a disability in the United States with a correlation coefficient (R) of 0.429 and weighted average of 16.1%, a difference of 33.5%.
Disability Correlation Summary
| Measurement | Croatian | Tsimshian |
| Minimum | 5.2% | 9.0% |
| Maximum | 46.0% | 30.5% |
| Range | 40.9% | 21.5% |
| Mean | 16.7% | 18.5% |
| Median | 14.7% | 18.5% |
| Interquartile 25% (IQ1) | 12.7% | 14.0% |
| Interquartile 75% (IQ3) | 18.8% | 24.0% |
| Interquartile Range (IQR) | 6.1% | 10.0% |
| Standard Deviation (Sample) | 7.4% | 6.1% |
| Standard Deviation (Population) | 7.3% | 5.9% |
Similar Demographics by Disability
Demographics Similar to Croatians by Disability
In terms of disability, the demographic groups most similar to Croatians are Immigrants from Jamaica (12.1%, a difference of 0.040%), Immigrants from Bahamas (12.1%, a difference of 0.040%), Panamanian (12.1%, a difference of 0.11%), Immigrants from North America (12.1%, a difference of 0.11%), and Northern European (12.1%, a difference of 0.16%).
| Demographics | Rating | Rank | Disability |
| Austrians | 7.2 /100 | #212 | Tragic 12.0% |
| Immigrants | Iraq | 7.1 /100 | #213 | Tragic 12.0% |
| Immigrants | Somalia | 6.8 /100 | #214 | Tragic 12.0% |
| Immigrants | Canada | 6.1 /100 | #215 | Tragic 12.1% |
| Panamanians | 5.4 /100 | #216 | Tragic 12.1% |
| Immigrants | North America | 5.3 /100 | #217 | Tragic 12.1% |
| Immigrants | Jamaica | 5.0 /100 | #218 | Tragic 12.1% |
| Croatians | 4.9 /100 | #219 | Tragic 12.1% |
| Immigrants | Bahamas | 4.7 /100 | #220 | Tragic 12.1% |
| Northern Europeans | 4.2 /100 | #221 | Tragic 12.1% |
| Spanish American Indians | 4.1 /100 | #222 | Tragic 12.1% |
| Hispanics or Latinos | 3.9 /100 | #223 | Tragic 12.1% |
| Mexicans | 3.7 /100 | #224 | Tragic 12.1% |
| Senegalese | 3.5 /100 | #225 | Tragic 12.1% |
| Jamaicans | 3.3 /100 | #226 | Tragic 12.1% |
Demographics Similar to Tsimshian by Disability
In terms of disability, the demographic groups most similar to Tsimshian are Puerto Rican (16.1%, a difference of 0.16%), Colville (15.8%, a difference of 2.2%), Creek (15.6%, a difference of 3.5%), Kiowa (15.6%, a difference of 3.5%), and Lumbee (15.5%, a difference of 3.9%).
| Demographics | Rating | Rank | Disability |
| Cajuns | 0.0 /100 | #333 | Tragic 14.6% |
| Yuman | 0.0 /100 | #334 | Tragic 14.6% |
| Tohono O'odham | 0.0 /100 | #335 | Tragic 14.8% |
| Cherokee | 0.0 /100 | #336 | Tragic 14.8% |
| Seminole | 0.0 /100 | #337 | Tragic 14.9% |
| Dutch West Indians | 0.0 /100 | #338 | Tragic 14.9% |
| Chickasaw | 0.0 /100 | #339 | Tragic 15.2% |
| Choctaw | 0.0 /100 | #340 | Tragic 15.4% |
| Lumbee | 0.0 /100 | #341 | Tragic 15.5% |
| Kiowa | 0.0 /100 | #342 | Tragic 15.6% |
| Creek | 0.0 /100 | #343 | Tragic 15.6% |
| Colville | 0.0 /100 | #344 | Tragic 15.8% |
| Puerto Ricans | 0.0 /100 | #345 | Tragic 16.1% |
| Tsimshian | 0.0 /100 | #346 | Tragic 16.1% |
| Houma | 0.0 /100 | #347 | Tragic 17.1% |