Creek vs Colombian Female Disability
COMPARE
Creek
Colombian
Female Disability
Female Disability Comparison
Creek
Colombians
15.7%
FEMALE DISABILITY
0.0/ 100
METRIC RATING
342nd/ 347
METRIC RANK
11.5%
FEMALE DISABILITY
99.8/ 100
METRIC RATING
69th/ 347
METRIC RANK
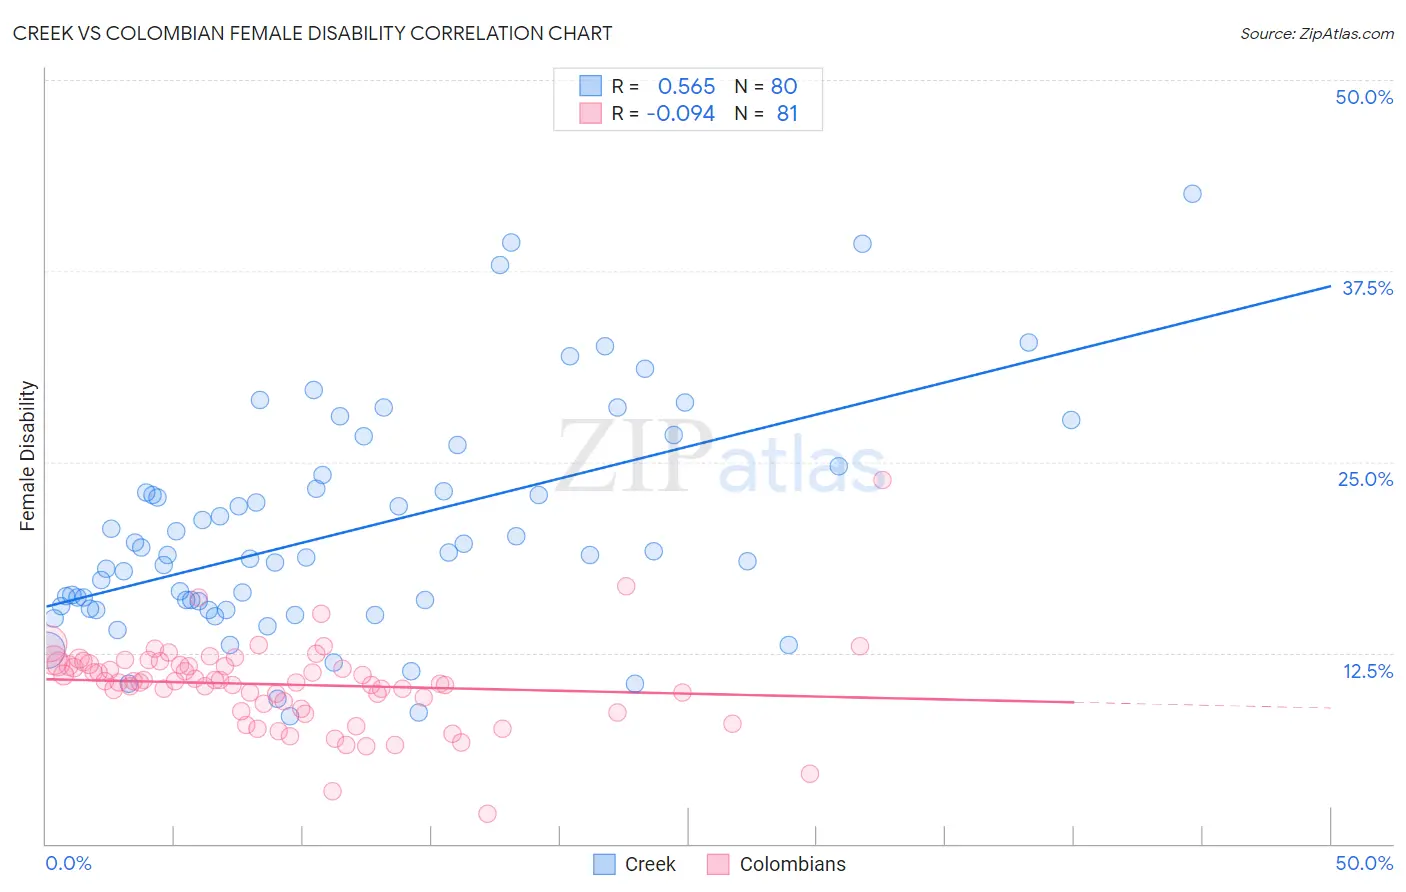
Creek vs Colombian Female Disability Correlation Chart
The statistical analysis conducted on geographies consisting of 178,448,690 people shows a substantial positive correlation between the proportion of Creek and percentage of females with a disability in the United States with a correlation coefficient (R) of 0.565 and weighted average of 15.7%. Similarly, the statistical analysis conducted on geographies consisting of 419,587,687 people shows a slight negative correlation between the proportion of Colombians and percentage of females with a disability in the United States with a correlation coefficient (R) of -0.094 and weighted average of 11.5%, a difference of 36.5%.
Female Disability Correlation Summary
| Measurement | Creek | Colombian |
| Minimum | 8.3% | 1.9% |
| Maximum | 42.6% | 23.8% |
| Range | 34.2% | 21.9% |
| Mean | 20.5% | 10.4% |
| Median | 18.9% | 10.6% |
| Interquartile 25% (IQ1) | 15.4% | 9.0% |
| Interquartile 75% (IQ3) | 23.7% | 11.7% |
| Interquartile Range (IQR) | 8.2% | 2.7% |
| Standard Deviation (Sample) | 7.3% | 2.9% |
| Standard Deviation (Population) | 7.3% | 2.9% |
Similar Demographics by Female Disability
Demographics Similar to Creek by Female Disability
In terms of female disability, the demographic groups most similar to Creek are Lumbee (15.8%, a difference of 0.68%), Kiowa (15.8%, a difference of 0.84%), Choctaw (15.4%, a difference of 1.6%), Chickasaw (15.2%, a difference of 3.0%), and Colville (15.1%, a difference of 4.0%).
| Demographics | Rating | Rank | Female Disability |
| Immigrants | Azores | 0.0 /100 | #333 | Tragic 14.9% |
| Cherokee | 0.0 /100 | #334 | Tragic 14.9% |
| Cajuns | 0.0 /100 | #335 | Tragic 14.9% |
| Seminole | 0.0 /100 | #336 | Tragic 15.0% |
| Tohono O'odham | 0.0 /100 | #337 | Tragic 15.0% |
| Dutch West Indians | 0.0 /100 | #338 | Tragic 15.0% |
| Colville | 0.0 /100 | #339 | Tragic 15.1% |
| Chickasaw | 0.0 /100 | #340 | Tragic 15.2% |
| Choctaw | 0.0 /100 | #341 | Tragic 15.4% |
| Creek | 0.0 /100 | #342 | Tragic 15.7% |
| Lumbee | 0.0 /100 | #343 | Tragic 15.8% |
| Kiowa | 0.0 /100 | #344 | Tragic 15.8% |
| Puerto Ricans | 0.0 /100 | #345 | Tragic 16.6% |
| Tsimshian | 0.0 /100 | #346 | Tragic 16.8% |
| Houma | 0.0 /100 | #347 | Tragic 16.9% |
Demographics Similar to Colombians by Female Disability
In terms of female disability, the demographic groups most similar to Colombians are Immigrants from Chile (11.5%, a difference of 0.010%), Immigrants from Ireland (11.5%, a difference of 0.050%), Immigrants from Northern Africa (11.5%, a difference of 0.070%), Immigrants from Vietnam (11.5%, a difference of 0.090%), and Chilean (11.5%, a difference of 0.12%).
| Demographics | Rating | Rank | Female Disability |
| Sri Lankans | 99.9 /100 | #62 | Exceptional 11.4% |
| Immigrants | Colombia | 99.9 /100 | #63 | Exceptional 11.4% |
| Immigrants | El Salvador | 99.9 /100 | #64 | Exceptional 11.4% |
| Immigrants | South America | 99.9 /100 | #65 | Exceptional 11.4% |
| Salvadorans | 99.8 /100 | #66 | Exceptional 11.5% |
| Immigrants | Vietnam | 99.8 /100 | #67 | Exceptional 11.5% |
| Immigrants | Northern Africa | 99.8 /100 | #68 | Exceptional 11.5% |
| Colombians | 99.8 /100 | #69 | Exceptional 11.5% |
| Immigrants | Chile | 99.8 /100 | #70 | Exceptional 11.5% |
| Immigrants | Ireland | 99.8 /100 | #71 | Exceptional 11.5% |
| Chileans | 99.8 /100 | #72 | Exceptional 11.5% |
| Immigrants | Switzerland | 99.8 /100 | #73 | Exceptional 11.5% |
| Bhutanese | 99.8 /100 | #74 | Exceptional 11.5% |
| Immigrants | Lebanon | 99.7 /100 | #75 | Exceptional 11.5% |
| Immigrants | Eritrea | 99.7 /100 | #76 | Exceptional 11.5% |