Creek vs Immigrants from Laos Female Disability
COMPARE
Creek
Immigrants from Laos
Female Disability
Female Disability Comparison
Creek
Immigrants from Laos
15.7%
FEMALE DISABILITY
0.0/ 100
METRIC RATING
342nd/ 347
METRIC RANK
12.8%
FEMALE DISABILITY
0.4/ 100
METRIC RATING
268th/ 347
METRIC RANK
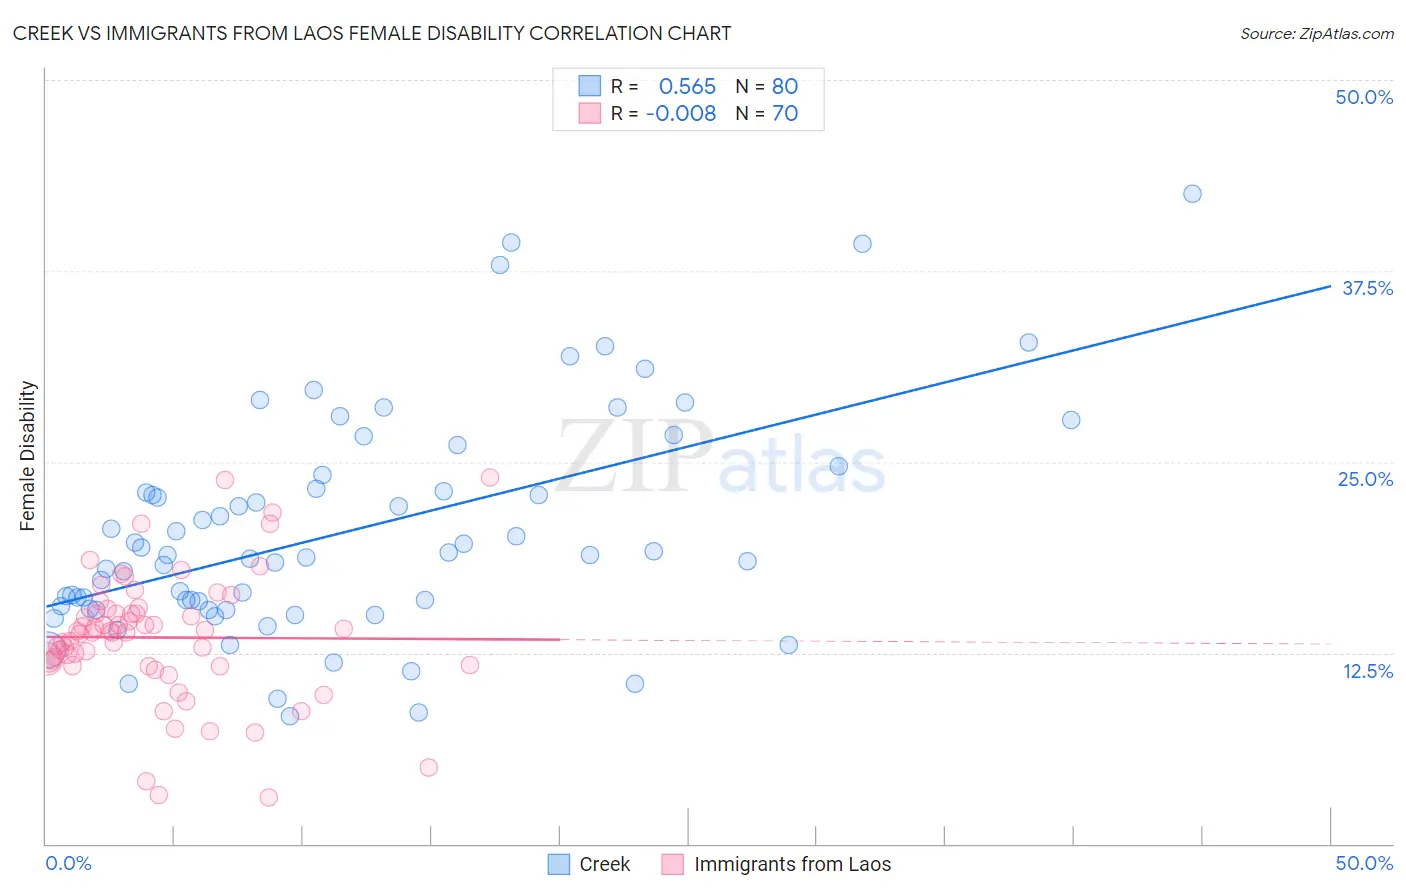
Creek vs Immigrants from Laos Female Disability Correlation Chart
The statistical analysis conducted on geographies consisting of 178,448,690 people shows a substantial positive correlation between the proportion of Creek and percentage of females with a disability in the United States with a correlation coefficient (R) of 0.565 and weighted average of 15.7%. Similarly, the statistical analysis conducted on geographies consisting of 201,465,776 people shows no correlation between the proportion of Immigrants from Laos and percentage of females with a disability in the United States with a correlation coefficient (R) of -0.008 and weighted average of 12.8%, a difference of 22.2%.
Female Disability Correlation Summary
| Measurement | Creek | Immigrants from Laos |
| Minimum | 8.3% | 3.0% |
| Maximum | 42.6% | 24.0% |
| Range | 34.2% | 20.9% |
| Mean | 20.5% | 13.5% |
| Median | 18.9% | 13.9% |
| Interquartile 25% (IQ1) | 15.4% | 11.7% |
| Interquartile 75% (IQ3) | 23.7% | 15.1% |
| Interquartile Range (IQR) | 8.2% | 3.4% |
| Standard Deviation (Sample) | 7.3% | 4.1% |
| Standard Deviation (Population) | 7.3% | 4.1% |
Similar Demographics by Female Disability
Demographics Similar to Creek by Female Disability
In terms of female disability, the demographic groups most similar to Creek are Lumbee (15.8%, a difference of 0.68%), Kiowa (15.8%, a difference of 0.84%), Choctaw (15.4%, a difference of 1.6%), Chickasaw (15.2%, a difference of 3.0%), and Colville (15.1%, a difference of 4.0%).
| Demographics | Rating | Rank | Female Disability |
| Immigrants | Azores | 0.0 /100 | #333 | Tragic 14.9% |
| Cherokee | 0.0 /100 | #334 | Tragic 14.9% |
| Cajuns | 0.0 /100 | #335 | Tragic 14.9% |
| Seminole | 0.0 /100 | #336 | Tragic 15.0% |
| Tohono O'odham | 0.0 /100 | #337 | Tragic 15.0% |
| Dutch West Indians | 0.0 /100 | #338 | Tragic 15.0% |
| Colville | 0.0 /100 | #339 | Tragic 15.1% |
| Chickasaw | 0.0 /100 | #340 | Tragic 15.2% |
| Choctaw | 0.0 /100 | #341 | Tragic 15.4% |
| Creek | 0.0 /100 | #342 | Tragic 15.7% |
| Lumbee | 0.0 /100 | #343 | Tragic 15.8% |
| Kiowa | 0.0 /100 | #344 | Tragic 15.8% |
| Puerto Ricans | 0.0 /100 | #345 | Tragic 16.6% |
| Tsimshian | 0.0 /100 | #346 | Tragic 16.8% |
| Houma | 0.0 /100 | #347 | Tragic 16.9% |
Demographics Similar to Immigrants from Laos by Female Disability
In terms of female disability, the demographic groups most similar to Immigrants from Laos are Senegalese (12.8%, a difference of 0.030%), Finnish (12.8%, a difference of 0.040%), Indonesian (12.8%, a difference of 0.060%), West Indian (12.8%, a difference of 0.16%), and Immigrants from Liberia (12.9%, a difference of 0.24%).
| Demographics | Rating | Rank | Female Disability |
| Bermudans | 1.0 /100 | #261 | Tragic 12.7% |
| Czechoslovakians | 0.9 /100 | #262 | Tragic 12.7% |
| Spaniards | 0.7 /100 | #263 | Tragic 12.8% |
| Alaska Natives | 0.6 /100 | #264 | Tragic 12.8% |
| West Indians | 0.5 /100 | #265 | Tragic 12.8% |
| Finns | 0.4 /100 | #266 | Tragic 12.8% |
| Senegalese | 0.4 /100 | #267 | Tragic 12.8% |
| Immigrants | Laos | 0.4 /100 | #268 | Tragic 12.8% |
| Indonesians | 0.4 /100 | #269 | Tragic 12.8% |
| Immigrants | Liberia | 0.3 /100 | #270 | Tragic 12.9% |
| Dutch | 0.2 /100 | #271 | Tragic 12.9% |
| Germans | 0.1 /100 | #272 | Tragic 12.9% |
| Sioux | 0.1 /100 | #273 | Tragic 12.9% |
| Portuguese | 0.1 /100 | #274 | Tragic 13.0% |
| Cheyenne | 0.1 /100 | #275 | Tragic 13.0% |