Greek vs Immigrants from Iraq Vision Disability
COMPARE
Greek
Immigrants from Iraq
Vision Disability
Vision Disability Comparison
Greeks
Immigrants from Iraq
2.1%
VISION DISABILITY
95.1/ 100
METRIC RATING
100th/ 347
METRIC RANK
2.1%
VISION DISABILITY
64.8/ 100
METRIC RATING
165th/ 347
METRIC RANK
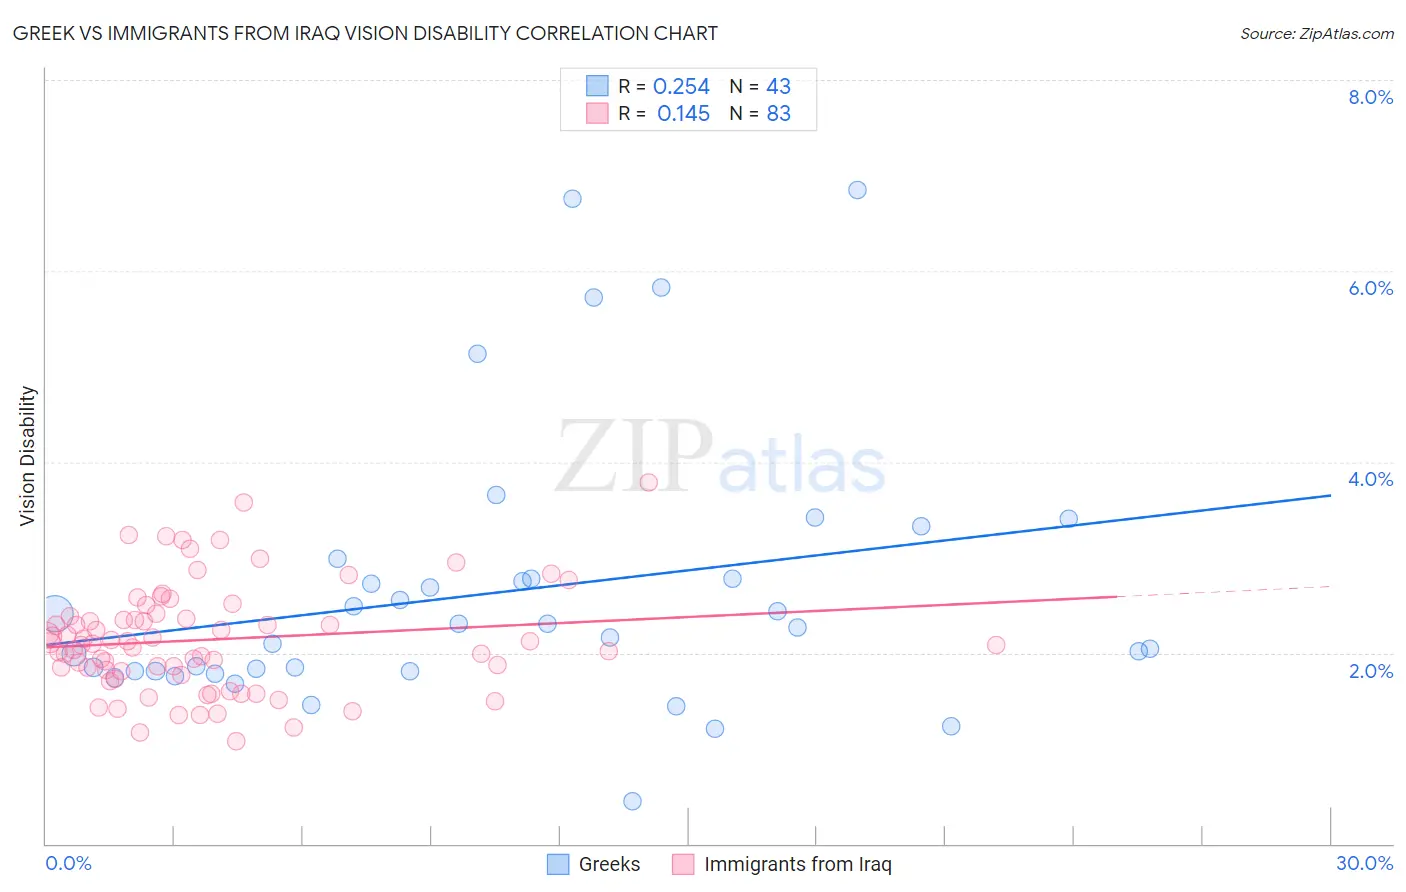
Greek vs Immigrants from Iraq Vision Disability Correlation Chart
The statistical analysis conducted on geographies consisting of 482,063,335 people shows a weak positive correlation between the proportion of Greeks and percentage of population with vision disability in the United States with a correlation coefficient (R) of 0.254 and weighted average of 2.1%. Similarly, the statistical analysis conducted on geographies consisting of 194,736,421 people shows a poor positive correlation between the proportion of Immigrants from Iraq and percentage of population with vision disability in the United States with a correlation coefficient (R) of 0.145 and weighted average of 2.1%, a difference of 3.9%.
Vision Disability Correlation Summary
| Measurement | Greek | Immigrants from Iraq |
| Minimum | 0.45% | 1.1% |
| Maximum | 6.8% | 3.8% |
| Range | 6.4% | 2.7% |
| Mean | 2.6% | 2.1% |
| Median | 2.3% | 2.1% |
| Interquartile 25% (IQ1) | 1.8% | 1.8% |
| Interquartile 75% (IQ3) | 2.8% | 2.4% |
| Interquartile Range (IQR) | 0.98% | 0.58% |
| Standard Deviation (Sample) | 1.4% | 0.56% |
| Standard Deviation (Population) | 1.4% | 0.56% |
Similar Demographics by Vision Disability
Demographics Similar to Greeks by Vision Disability
In terms of vision disability, the demographic groups most similar to Greeks are Estonian (2.1%, a difference of 0.040%), Albanian (2.1%, a difference of 0.080%), Immigrants from South Africa (2.1%, a difference of 0.11%), Sri Lankan (2.1%, a difference of 0.11%), and Immigrants from Afghanistan (2.1%, a difference of 0.16%).
| Demographics | Rating | Rank | Vision Disability |
| Immigrants | Europe | 96.1 /100 | #93 | Exceptional 2.1% |
| Immigrants | Croatia | 96.0 /100 | #94 | Exceptional 2.1% |
| Australians | 95.9 /100 | #95 | Exceptional 2.1% |
| Romanians | 95.7 /100 | #96 | Exceptional 2.1% |
| Immigrants | Afghanistan | 95.6 /100 | #97 | Exceptional 2.1% |
| Immigrants | South Africa | 95.4 /100 | #98 | Exceptional 2.1% |
| Estonians | 95.3 /100 | #99 | Exceptional 2.1% |
| Greeks | 95.1 /100 | #100 | Exceptional 2.1% |
| Albanians | 94.9 /100 | #101 | Exceptional 2.1% |
| Sri Lankans | 94.8 /100 | #102 | Exceptional 2.1% |
| Immigrants | Austria | 94.4 /100 | #103 | Exceptional 2.1% |
| Immigrants | Italy | 94.4 /100 | #104 | Exceptional 2.1% |
| Carpatho Rusyns | 94.3 /100 | #105 | Exceptional 2.1% |
| Swedes | 94.2 /100 | #106 | Exceptional 2.1% |
| Danes | 94.2 /100 | #107 | Exceptional 2.1% |
Demographics Similar to Immigrants from Iraq by Vision Disability
In terms of vision disability, the demographic groups most similar to Immigrants from Iraq are Immigrants from Bangladesh (2.1%, a difference of 0.050%), Icelander (2.1%, a difference of 0.090%), Immigrants from England (2.1%, a difference of 0.14%), Immigrants from Africa (2.1%, a difference of 0.15%), and Hungarian (2.1%, a difference of 0.18%).
| Demographics | Rating | Rank | Vision Disability |
| Immigrants | Uzbekistan | 69.9 /100 | #158 | Good 2.1% |
| South Africans | 69.8 /100 | #159 | Good 2.1% |
| Austrians | 69.0 /100 | #160 | Good 2.1% |
| Iraqis | 67.7 /100 | #161 | Good 2.1% |
| Hungarians | 67.4 /100 | #162 | Good 2.1% |
| Icelanders | 66.1 /100 | #163 | Good 2.1% |
| Immigrants | Bangladesh | 65.5 /100 | #164 | Good 2.1% |
| Immigrants | Iraq | 64.8 /100 | #165 | Good 2.1% |
| Immigrants | England | 62.8 /100 | #166 | Good 2.1% |
| Immigrants | Africa | 62.6 /100 | #167 | Good 2.1% |
| Brazilians | 62.2 /100 | #168 | Good 2.1% |
| South American Indians | 57.4 /100 | #169 | Average 2.2% |
| Swiss | 55.7 /100 | #170 | Average 2.2% |
| Lebanese | 54.3 /100 | #171 | Average 2.2% |
| Northern Europeans | 50.1 /100 | #172 | Average 2.2% |