Cree vs Immigrants from Iraq Cognitive Disability
COMPARE
Cree
Immigrants from Iraq
Cognitive Disability
Cognitive Disability Comparison
Cree
Immigrants from Iraq
17.9%
COGNITIVE DISABILITY
0.7/ 100
METRIC RATING
249th/ 347
METRIC RANK
17.8%
COGNITIVE DISABILITY
1.8/ 100
METRIC RATING
236th/ 347
METRIC RANK
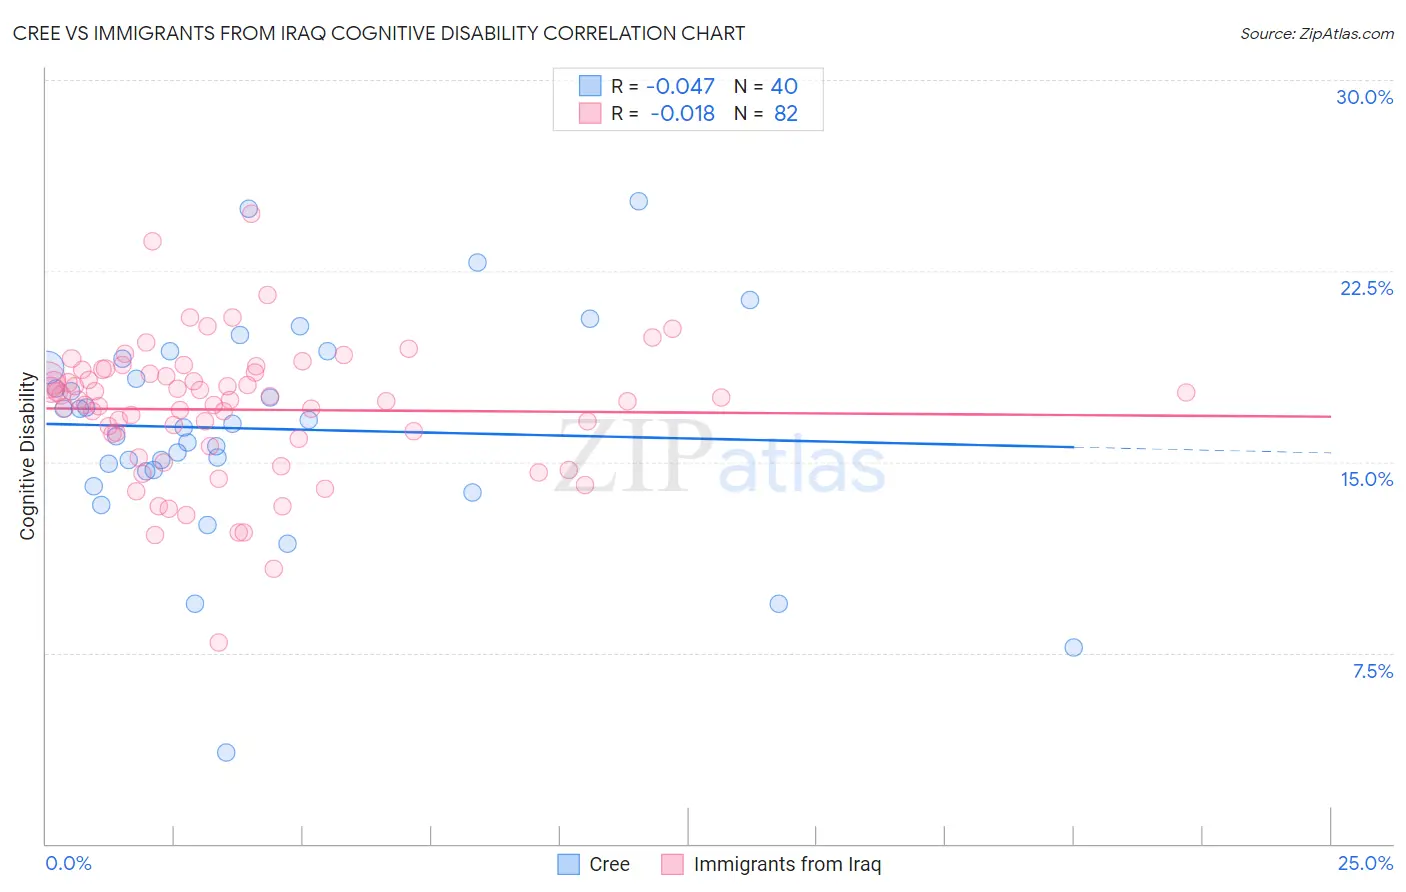
Cree vs Immigrants from Iraq Cognitive Disability Correlation Chart
The statistical analysis conducted on geographies consisting of 76,210,632 people shows no correlation between the proportion of Cree and percentage of population with cognitive disability in the United States with a correlation coefficient (R) of -0.047 and weighted average of 17.9%. Similarly, the statistical analysis conducted on geographies consisting of 194,729,131 people shows no correlation between the proportion of Immigrants from Iraq and percentage of population with cognitive disability in the United States with a correlation coefficient (R) of -0.018 and weighted average of 17.8%, a difference of 0.72%.
Cognitive Disability Correlation Summary
| Measurement | Cree | Immigrants from Iraq |
| Minimum | 3.6% | 7.9% |
| Maximum | 25.2% | 24.7% |
| Range | 21.7% | 16.8% |
| Mean | 16.3% | 17.0% |
| Median | 16.4% | 17.4% |
| Interquartile 25% (IQ1) | 14.7% | 15.9% |
| Interquartile 75% (IQ3) | 18.9% | 18.5% |
| Interquartile Range (IQR) | 4.2% | 2.6% |
| Standard Deviation (Sample) | 4.3% | 2.7% |
| Standard Deviation (Population) | 4.2% | 2.6% |
Demographics Similar to Cree and Immigrants from Iraq by Cognitive Disability
In terms of cognitive disability, the demographic groups most similar to Cree are Immigrants from Ethiopia (17.9%, a difference of 0.0%), Malaysian (17.9%, a difference of 0.010%), Immigrants from Grenada (17.9%, a difference of 0.020%), French American Indian (17.9%, a difference of 0.050%), and Samoan (17.9%, a difference of 0.060%). Similarly, the demographic groups most similar to Immigrants from Iraq are Immigrants from Mexico (17.8%, a difference of 0.010%), Cheyenne (17.8%, a difference of 0.040%), Osage (17.8%, a difference of 0.060%), Spanish American Indian (17.8%, a difference of 0.060%), and Tongan (17.8%, a difference of 0.080%).
| Demographics | Rating | Rank | Cognitive Disability |
| Tongans | 2.1 /100 | #232 | Tragic 17.8% |
| Panamanians | 2.1 /100 | #233 | Tragic 17.8% |
| Osage | 2.0 /100 | #234 | Tragic 17.8% |
| Spanish American Indians | 2.0 /100 | #235 | Tragic 17.8% |
| Immigrants | Iraq | 1.8 /100 | #236 | Tragic 17.8% |
| Immigrants | Mexico | 1.8 /100 | #237 | Tragic 17.8% |
| Cheyenne | 1.7 /100 | #238 | Tragic 17.8% |
| Cajuns | 1.4 /100 | #239 | Tragic 17.8% |
| Iraqis | 1.4 /100 | #240 | Tragic 17.8% |
| Mexicans | 1.1 /100 | #241 | Tragic 17.8% |
| Paiute | 1.1 /100 | #242 | Tragic 17.8% |
| Immigrants | Bangladesh | 1.0 /100 | #243 | Tragic 17.8% |
| Jamaicans | 0.9 /100 | #244 | Tragic 17.9% |
| Trinidadians and Tobagonians | 0.8 /100 | #245 | Tragic 17.9% |
| Immigrants | Thailand | 0.8 /100 | #246 | Tragic 17.9% |
| Samoans | 0.7 /100 | #247 | Tragic 17.9% |
| French American Indians | 0.7 /100 | #248 | Tragic 17.9% |
| Cree | 0.7 /100 | #249 | Tragic 17.9% |
| Immigrants | Ethiopia | 0.7 /100 | #250 | Tragic 17.9% |
| Malaysians | 0.6 /100 | #251 | Tragic 17.9% |
| Immigrants | Grenada | 0.6 /100 | #252 | Tragic 17.9% |