German vs Immigrants from Iraq Vision Disability
COMPARE
German
Immigrants from Iraq
Vision Disability
Vision Disability Comparison
Germans
Immigrants from Iraq
2.2%
VISION DISABILITY
13.4/ 100
METRIC RATING
208th/ 347
METRIC RANK
2.1%
VISION DISABILITY
64.8/ 100
METRIC RATING
165th/ 347
METRIC RANK
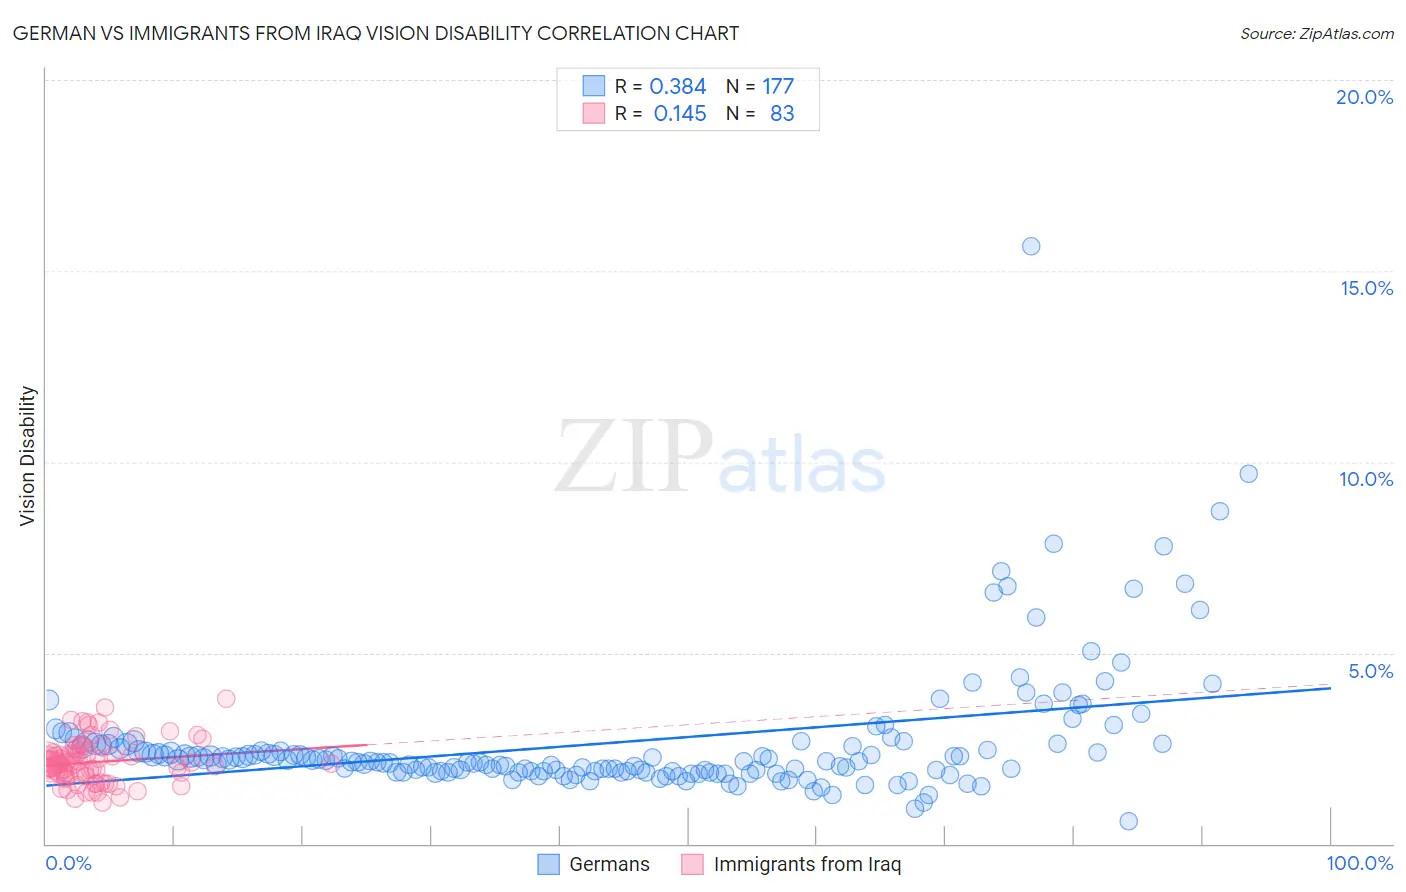
German vs Immigrants from Iraq Vision Disability Correlation Chart
The statistical analysis conducted on geographies consisting of 578,195,961 people shows a mild positive correlation between the proportion of Germans and percentage of population with vision disability in the United States with a correlation coefficient (R) of 0.384 and weighted average of 2.2%. Similarly, the statistical analysis conducted on geographies consisting of 194,736,421 people shows a poor positive correlation between the proportion of Immigrants from Iraq and percentage of population with vision disability in the United States with a correlation coefficient (R) of 0.145 and weighted average of 2.1%, a difference of 3.9%.
Vision Disability Correlation Summary
| Measurement | German | Immigrants from Iraq |
| Minimum | 0.58% | 1.1% |
| Maximum | 15.7% | 3.8% |
| Range | 15.1% | 2.7% |
| Mean | 2.7% | 2.1% |
| Median | 2.2% | 2.1% |
| Interquartile 25% (IQ1) | 1.9% | 1.8% |
| Interquartile 75% (IQ3) | 2.6% | 2.4% |
| Interquartile Range (IQR) | 0.71% | 0.58% |
| Standard Deviation (Sample) | 1.7% | 0.56% |
| Standard Deviation (Population) | 1.7% | 0.56% |
Similar Demographics by Vision Disability
Demographics Similar to Germans by Vision Disability
In terms of vision disability, the demographic groups most similar to Germans are Immigrants from Nigeria (2.2%, a difference of 0.010%), Immigrants from Brazil (2.2%, a difference of 0.040%), Pennsylvania German (2.2%, a difference of 0.14%), Immigrants from Uruguay (2.2%, a difference of 0.27%), and Samoan (2.2%, a difference of 0.28%).
| Demographics | Rating | Rank | Vision Disability |
| Slovaks | 18.8 /100 | #201 | Poor 2.2% |
| Immigrants | Zaire | 18.0 /100 | #202 | Poor 2.2% |
| Dutch | 17.1 /100 | #203 | Poor 2.2% |
| Immigrants | Guyana | 15.9 /100 | #204 | Poor 2.2% |
| Samoans | 15.7 /100 | #205 | Poor 2.2% |
| Pennsylvania Germans | 14.5 /100 | #206 | Poor 2.2% |
| Immigrants | Nigeria | 13.5 /100 | #207 | Poor 2.2% |
| Germans | 13.4 /100 | #208 | Poor 2.2% |
| Immigrants | Brazil | 13.1 /100 | #209 | Poor 2.2% |
| Immigrants | Uruguay | 11.5 /100 | #210 | Poor 2.2% |
| Indonesians | 9.5 /100 | #211 | Tragic 2.2% |
| Bermudans | 9.0 /100 | #212 | Tragic 2.2% |
| Immigrants | Ghana | 8.9 /100 | #213 | Tragic 2.2% |
| Trinidadians and Tobagonians | 8.2 /100 | #214 | Tragic 2.2% |
| Nigerians | 7.2 /100 | #215 | Tragic 2.3% |
Demographics Similar to Immigrants from Iraq by Vision Disability
In terms of vision disability, the demographic groups most similar to Immigrants from Iraq are Immigrants from Bangladesh (2.1%, a difference of 0.050%), Icelander (2.1%, a difference of 0.090%), Immigrants from England (2.1%, a difference of 0.14%), Immigrants from Africa (2.1%, a difference of 0.15%), and Hungarian (2.1%, a difference of 0.18%).
| Demographics | Rating | Rank | Vision Disability |
| Immigrants | Uzbekistan | 69.9 /100 | #158 | Good 2.1% |
| South Africans | 69.8 /100 | #159 | Good 2.1% |
| Austrians | 69.0 /100 | #160 | Good 2.1% |
| Iraqis | 67.7 /100 | #161 | Good 2.1% |
| Hungarians | 67.4 /100 | #162 | Good 2.1% |
| Icelanders | 66.1 /100 | #163 | Good 2.1% |
| Immigrants | Bangladesh | 65.5 /100 | #164 | Good 2.1% |
| Immigrants | Iraq | 64.8 /100 | #165 | Good 2.1% |
| Immigrants | England | 62.8 /100 | #166 | Good 2.1% |
| Immigrants | Africa | 62.6 /100 | #167 | Good 2.1% |
| Brazilians | 62.2 /100 | #168 | Good 2.1% |
| South American Indians | 57.4 /100 | #169 | Average 2.2% |
| Swiss | 55.7 /100 | #170 | Average 2.2% |
| Lebanese | 54.3 /100 | #171 | Average 2.2% |
| Northern Europeans | 50.1 /100 | #172 | Average 2.2% |