Cree vs Immigrants from Iraq Median Earnings
COMPARE
Cree
Immigrants from Iraq
Median Earnings
Median Earnings Comparison
Cree
Immigrants from Iraq
$42,777
MEDIAN EARNINGS
0.6/ 100
METRIC RATING
267th/ 347
METRIC RANK
$44,988
MEDIAN EARNINGS
11.6/ 100
METRIC RATING
228th/ 347
METRIC RANK
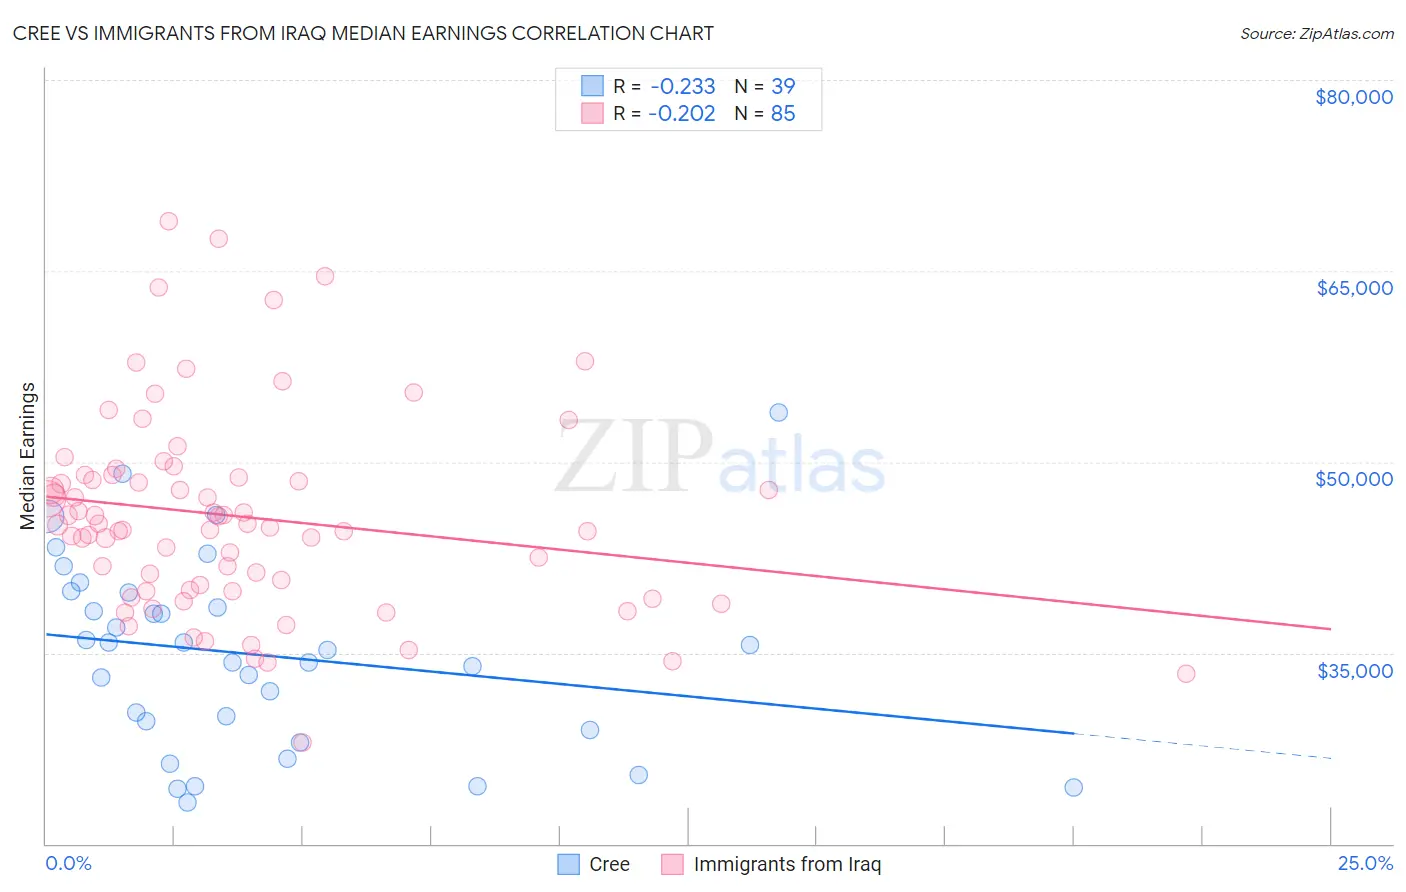
Cree vs Immigrants from Iraq Median Earnings Correlation Chart
The statistical analysis conducted on geographies consisting of 76,210,467 people shows a weak negative correlation between the proportion of Cree and median earnings in the United States with a correlation coefficient (R) of -0.233 and weighted average of $42,777. Similarly, the statistical analysis conducted on geographies consisting of 194,784,427 people shows a weak negative correlation between the proportion of Immigrants from Iraq and median earnings in the United States with a correlation coefficient (R) of -0.202 and weighted average of $44,988, a difference of 5.2%.
Median Earnings Correlation Summary
| Measurement | Cree | Immigrants from Iraq |
| Minimum | $23,200 | $27,932 |
| Maximum | $53,900 | $68,937 |
| Range | $30,700 | $41,005 |
| Mean | $34,814 | $45,692 |
| Median | $35,233 | $45,037 |
| Interquartile 25% (IQ1) | $28,896 | $39,916 |
| Interquartile 75% (IQ3) | $39,775 | $48,838 |
| Interquartile Range (IQR) | $10,879 | $8,923 |
| Standard Deviation (Sample) | $7,415 | $7,829 |
| Standard Deviation (Population) | $7,320 | $7,782 |
Similar Demographics by Median Earnings
Demographics Similar to Cree by Median Earnings
In terms of median earnings, the demographic groups most similar to Cree are American ($42,742, a difference of 0.080%), Belizean ($42,702, a difference of 0.17%), Immigrants from Laos ($42,884, a difference of 0.25%), Osage ($42,651, a difference of 0.29%), and Salvadoran ($42,912, a difference of 0.32%).
| Demographics | Rating | Rank | Median Earnings |
| Immigrants | Somalia | 0.9 /100 | #260 | Tragic $43,100 |
| Immigrants | Jamaica | 0.8 /100 | #261 | Tragic $43,026 |
| Nicaraguans | 0.8 /100 | #262 | Tragic $43,026 |
| Inupiat | 0.8 /100 | #263 | Tragic $43,000 |
| Immigrants | Liberia | 0.7 /100 | #264 | Tragic $42,923 |
| Salvadorans | 0.7 /100 | #265 | Tragic $42,912 |
| Immigrants | Laos | 0.7 /100 | #266 | Tragic $42,884 |
| Cree | 0.6 /100 | #267 | Tragic $42,777 |
| Americans | 0.6 /100 | #268 | Tragic $42,742 |
| Belizeans | 0.5 /100 | #269 | Tragic $42,702 |
| Osage | 0.5 /100 | #270 | Tragic $42,651 |
| Pennsylvania Germans | 0.5 /100 | #271 | Tragic $42,615 |
| Iroquois | 0.4 /100 | #272 | Tragic $42,430 |
| Immigrants | Dominica | 0.4 /100 | #273 | Tragic $42,420 |
| Immigrants | El Salvador | 0.4 /100 | #274 | Tragic $42,413 |
Demographics Similar to Immigrants from Iraq by Median Earnings
In terms of median earnings, the demographic groups most similar to Immigrants from Iraq are Immigrants from Nigeria ($45,030, a difference of 0.090%), Native Hawaiian ($45,027, a difference of 0.090%), Scotch-Irish ($44,924, a difference of 0.14%), Immigrants from Western Africa ($44,893, a difference of 0.21%), and Immigrants from Cambodia ($45,090, a difference of 0.22%).
| Demographics | Rating | Rank | Median Earnings |
| Immigrants | Guyana | 15.1 /100 | #221 | Poor $45,204 |
| Immigrants | Panama | 15.0 /100 | #222 | Poor $45,198 |
| Whites/Caucasians | 15.0 /100 | #223 | Poor $45,197 |
| West Indians | 13.9 /100 | #224 | Poor $45,132 |
| Immigrants | Cambodia | 13.2 /100 | #225 | Poor $45,090 |
| Immigrants | Nigeria | 12.2 /100 | #226 | Poor $45,030 |
| Native Hawaiians | 12.2 /100 | #227 | Poor $45,027 |
| Immigrants | Iraq | 11.6 /100 | #228 | Poor $44,988 |
| Scotch-Irish | 10.7 /100 | #229 | Poor $44,924 |
| Immigrants | Western Africa | 10.3 /100 | #230 | Poor $44,893 |
| Japanese | 9.5 /100 | #231 | Tragic $44,825 |
| Delaware | 9.0 /100 | #232 | Tragic $44,783 |
| Immigrants | Sudan | 8.8 /100 | #233 | Tragic $44,767 |
| Cape Verdeans | 7.5 /100 | #234 | Tragic $44,640 |
| Venezuelans | 6.9 /100 | #235 | Tragic $44,580 |