Immigrants from the Azores vs Immigrants from Iraq Vision Disability
COMPARE
Immigrants from the Azores
Immigrants from Iraq
Vision Disability
Vision Disability Comparison
Immigrants from the Azores
Immigrants from Iraq
2.4%
VISION DISABILITY
0.1/ 100
METRIC RATING
271st/ 347
METRIC RANK
2.1%
VISION DISABILITY
64.8/ 100
METRIC RATING
165th/ 347
METRIC RANK
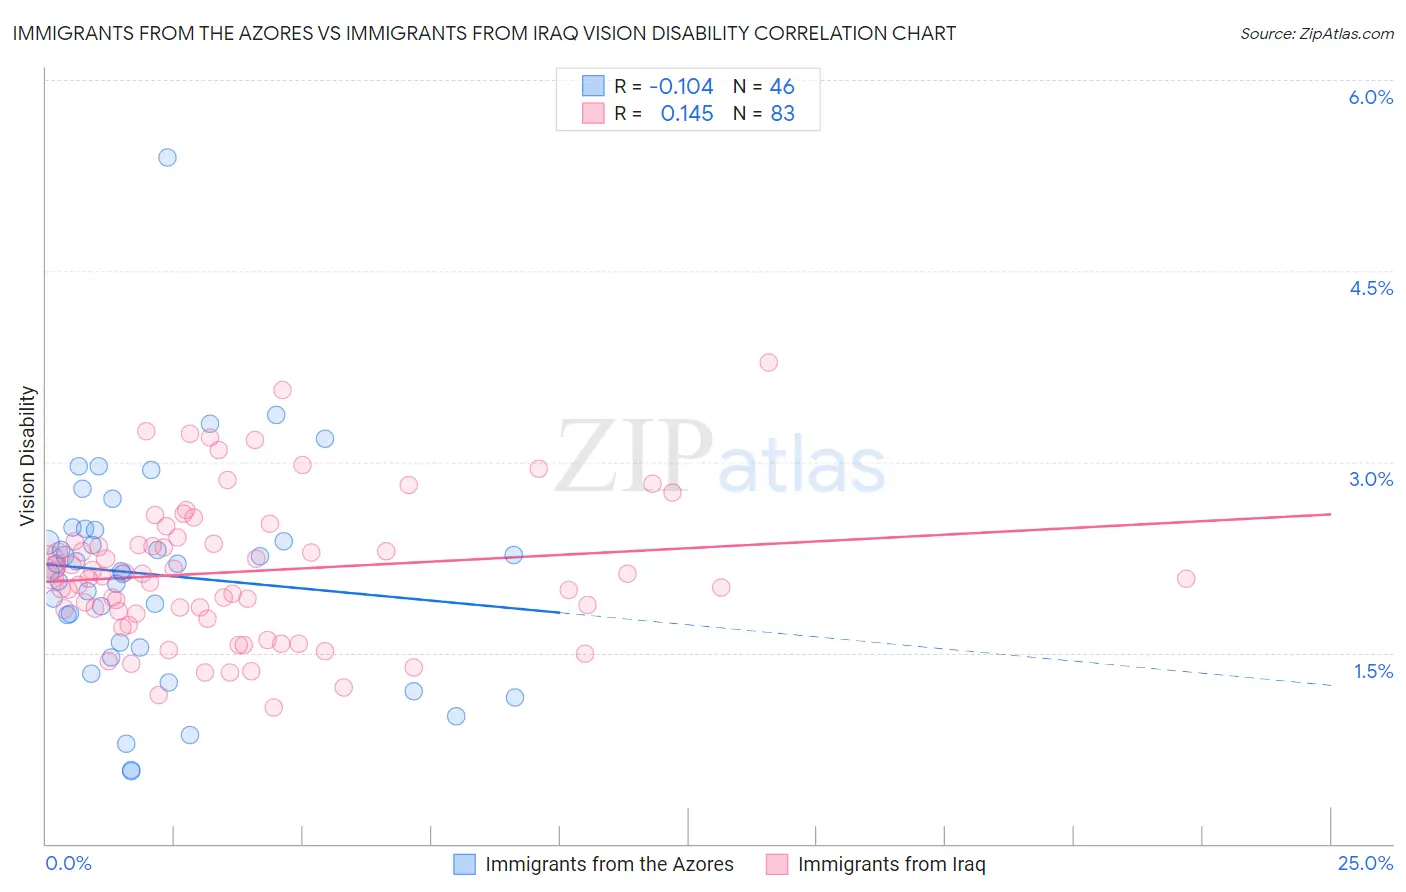
Immigrants from the Azores vs Immigrants from Iraq Vision Disability Correlation Chart
The statistical analysis conducted on geographies consisting of 46,255,686 people shows a poor negative correlation between the proportion of Immigrants from the Azores and percentage of population with vision disability in the United States with a correlation coefficient (R) of -0.104 and weighted average of 2.4%. Similarly, the statistical analysis conducted on geographies consisting of 194,736,421 people shows a poor positive correlation between the proportion of Immigrants from Iraq and percentage of population with vision disability in the United States with a correlation coefficient (R) of 0.145 and weighted average of 2.1%, a difference of 12.4%.
Vision Disability Correlation Summary
| Measurement | Immigrants from the Azores | Immigrants from Iraq |
| Minimum | 0.57% | 1.1% |
| Maximum | 5.4% | 3.8% |
| Range | 4.8% | 2.7% |
| Mean | 2.1% | 2.1% |
| Median | 2.2% | 2.1% |
| Interquartile 25% (IQ1) | 1.6% | 1.8% |
| Interquartile 75% (IQ3) | 2.5% | 2.4% |
| Interquartile Range (IQR) | 0.89% | 0.58% |
| Standard Deviation (Sample) | 0.85% | 0.56% |
| Standard Deviation (Population) | 0.84% | 0.56% |
Similar Demographics by Vision Disability
Demographics Similar to Immigrants from the Azores by Vision Disability
In terms of vision disability, the demographic groups most similar to Immigrants from the Azores are Spaniard (2.4%, a difference of 0.10%), Celtic (2.4%, a difference of 0.16%), Cuban (2.4%, a difference of 0.16%), Immigrants from Bahamas (2.4%, a difference of 0.43%), and Senegalese (2.4%, a difference of 0.44%).
| Demographics | Rating | Rank | Vision Disability |
| Immigrants | Liberia | 0.1 /100 | #264 | Tragic 2.4% |
| Immigrants | Jamaica | 0.1 /100 | #265 | Tragic 2.4% |
| Mexican American Indians | 0.1 /100 | #266 | Tragic 2.4% |
| Ute | 0.1 /100 | #267 | Tragic 2.4% |
| Senegalese | 0.1 /100 | #268 | Tragic 2.4% |
| Celtics | 0.1 /100 | #269 | Tragic 2.4% |
| Cubans | 0.1 /100 | #270 | Tragic 2.4% |
| Immigrants | Azores | 0.1 /100 | #271 | Tragic 2.4% |
| Spaniards | 0.1 /100 | #272 | Tragic 2.4% |
| Immigrants | Bahamas | 0.1 /100 | #273 | Tragic 2.4% |
| Immigrants | Latin America | 0.0 /100 | #274 | Tragic 2.4% |
| Chippewa | 0.0 /100 | #275 | Tragic 2.4% |
| Scotch-Irish | 0.0 /100 | #276 | Tragic 2.4% |
| Bahamians | 0.0 /100 | #277 | Tragic 2.4% |
| Spanish | 0.0 /100 | #278 | Tragic 2.4% |
Demographics Similar to Immigrants from Iraq by Vision Disability
In terms of vision disability, the demographic groups most similar to Immigrants from Iraq are Immigrants from Bangladesh (2.1%, a difference of 0.050%), Icelander (2.1%, a difference of 0.090%), Immigrants from England (2.1%, a difference of 0.14%), Immigrants from Africa (2.1%, a difference of 0.15%), and Hungarian (2.1%, a difference of 0.18%).
| Demographics | Rating | Rank | Vision Disability |
| Immigrants | Uzbekistan | 69.9 /100 | #158 | Good 2.1% |
| South Africans | 69.8 /100 | #159 | Good 2.1% |
| Austrians | 69.0 /100 | #160 | Good 2.1% |
| Iraqis | 67.7 /100 | #161 | Good 2.1% |
| Hungarians | 67.4 /100 | #162 | Good 2.1% |
| Icelanders | 66.1 /100 | #163 | Good 2.1% |
| Immigrants | Bangladesh | 65.5 /100 | #164 | Good 2.1% |
| Immigrants | Iraq | 64.8 /100 | #165 | Good 2.1% |
| Immigrants | England | 62.8 /100 | #166 | Good 2.1% |
| Immigrants | Africa | 62.6 /100 | #167 | Good 2.1% |
| Brazilians | 62.2 /100 | #168 | Good 2.1% |
| South American Indians | 57.4 /100 | #169 | Average 2.2% |
| Swiss | 55.7 /100 | #170 | Average 2.2% |
| Lebanese | 54.3 /100 | #171 | Average 2.2% |
| Northern Europeans | 50.1 /100 | #172 | Average 2.2% |